

Why the Bitcoin price could shatter its support
Despite a slight bounce over the last 24 hours, bringing the price of Bitcoin to around $67,300 (+0.8%), the underlying trend remains uncertain. The market is showing signs of fatigue after weeks of high volatility. Investors were hoping for a swift recovery, but technical data points to an exhaustion of buying momentum.
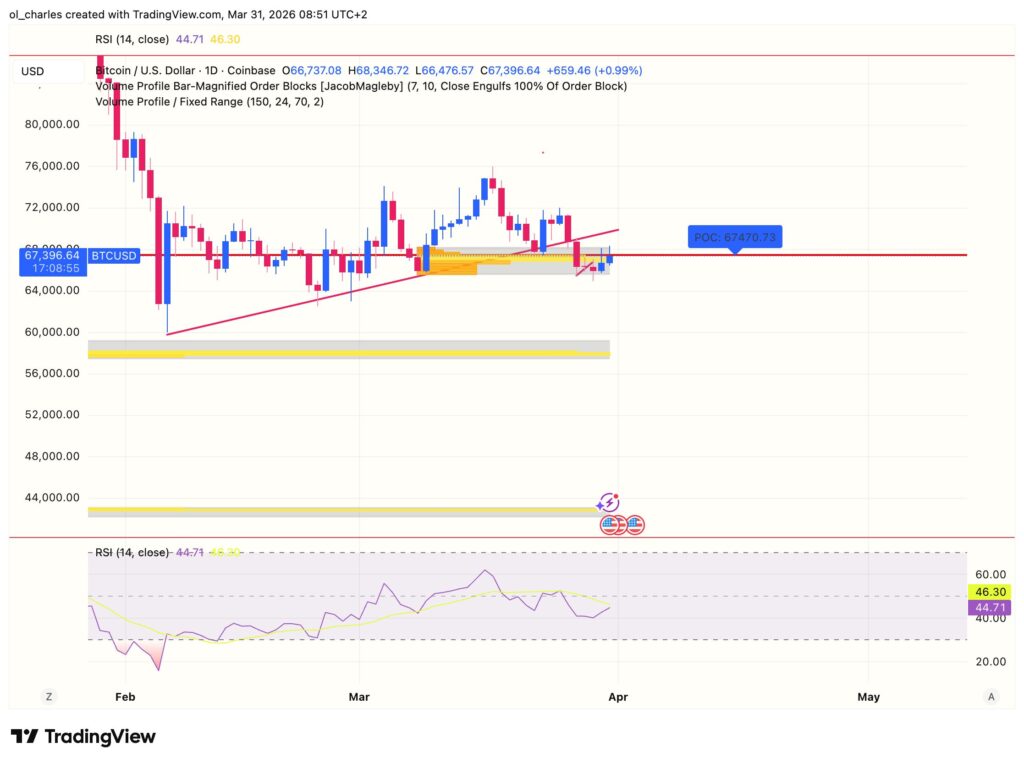
Indeed, Bitcoin has slipped back below its daily POC and is failing to break out to the upside, even after dropping into a major demand zone on a daily order block.
It is in this context that veteran trader Peter Brandt has reiterated his cautious stance. According to him, the current setup is decidedly bearish in the short term. He believes the flagship cryptocurrency will not reach a new all time high (ATH) by the end of the year, thereby dampening hopes for the start of a bull run in 2026.
For Brandt, the market needs to purge its excesses. He anticipates a massive retracement toward the $60,000 zone. This level acts as a critical support. If the price approaches it, selling pressure could intensify, potentially triggering a breakdown if buyers fail to defend this frontline.
Heading toward several months of consolidation before the final capitulation?
As mentioned in our previous article, Bitcoin is approaching a bottom zone similar to that of 2022. As Killa pointed out on X, a consolidation phase lasting several months could take hold until September, with a potential bottom between June and July:
“If we continue to follow the trend observed so far, we can expect a few more months of volatility, which makes sense in a bear market. A gradual capitulation first, then a true capitulation later. But gradually… not all at once.”
Although many traders are divided between a sharp surge to $80,000 and a crash to $45,000, the coming months could simply be the calm before the storm.
When could Bitcoin reach a new ATH if it follows the 2022 cycle?
If it follows the same pace, Bitcoin could hit its ATH by September or October 2027, which is nearly 560 days from today.
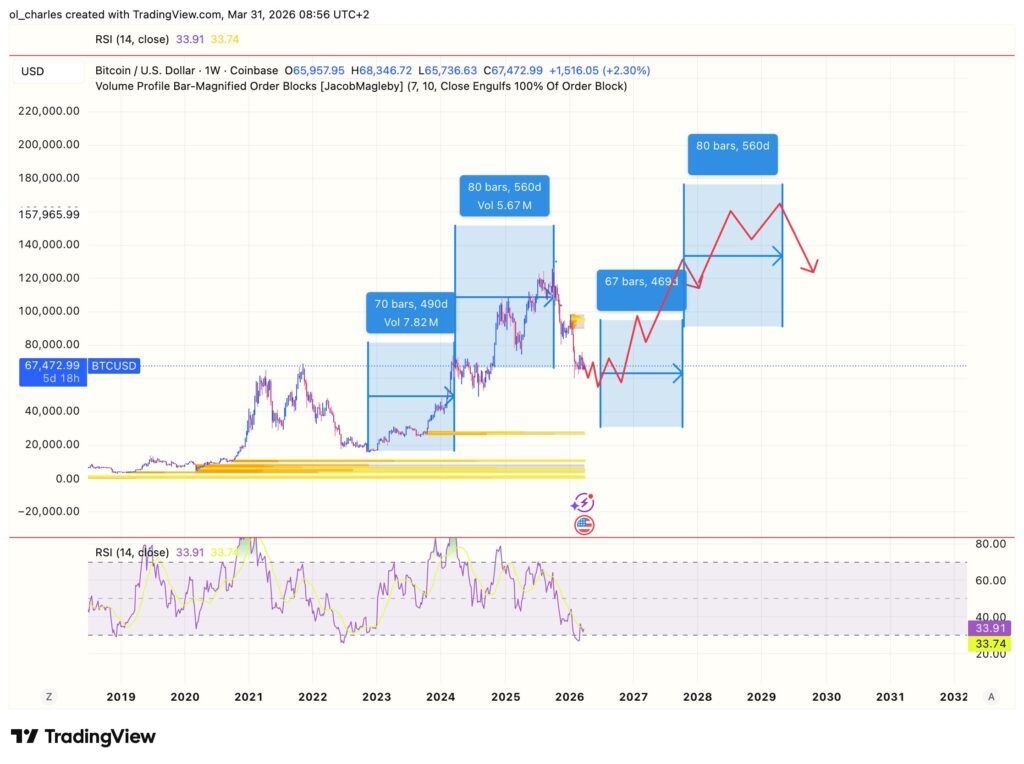
Subsequently, 560 days after this potential new ATH, Bitcoin could find its peak between $150,000 and $220,000 between May and July 2029.
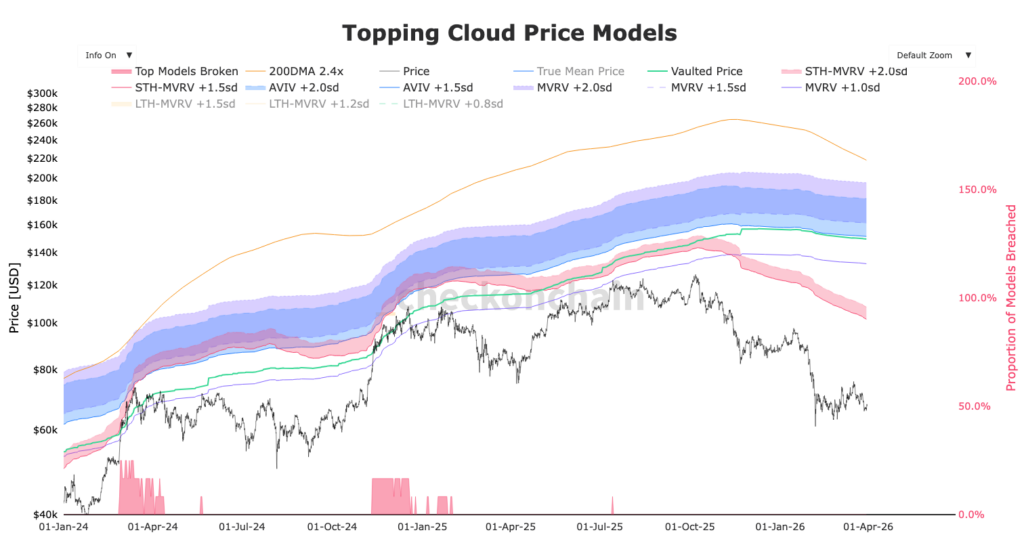
This is a zone indicated by the Topping Cloud Price Models. This chart overlays several on chain models (such as MVRV multiples for short term holders, AVIV, True Mean Price, etc.) that historically indicate areas where Bitcoin becomes overpriced and where investors take massive profits.
The MVRV is the ratio between the current price of Bitcoin (Market Value) and the average purchase price of all circulating BTC (Realized Price / Realized Value). It measures the average unrealized profit of all holders.
Meanwhile, AVIV is a more modern and improved version of the MVRV, based on Cointime Economics. Instead of taking all BTC into account (including lost coins or those dormant for years), AVIV focuses on active BTC (those that are actually moving, representing active investors).
The AVIV band sits between $150,000 and $180,000, which helps refine the potential Bitcoin peak for the next cycle.
Is it the right time to take a position in the market?
The prospect of a drop toward $60,000 raises a crucial question for traders: should you flee or accumulate? Historically, severe correction phases have often provided optimal entry points before the start of a new bull run. The $60,000 level will therefore be closely monitored by whales.
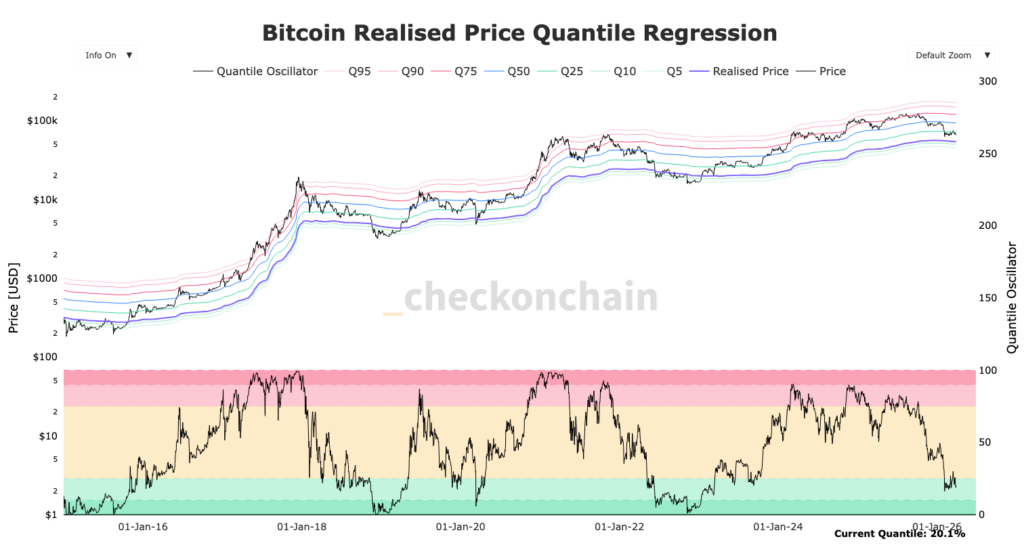
To navigate this, the Bitcoin Realized Price Quantile Regression chart allows investors to optimize their DCA. A return to the extreme green zone (between $53,000 and $45,000) therefore appears to be the optimal area to enter the market, assuming Bitcoin follows the same trend as in previous cycles. Bitcoin has always bottomed out in this extreme green zone.
Sources:
- Checkonchain
- Tradingview
- X – KillaXBT & Peter Brandt
- CoinGape
Related Articles:

