

ETF Hemorrhage: The Warning Signal?
The crypto market is holding its breath. After a promising start to the year, the wind has turned with unexpected violence. In just two days (January 6 and 7), the Spot Bitcoin ETFs recorded cumulative net outflows of $729 million. This massive movement of institutional capital immediately impacted market sentiment, causing the fear and greed index to shift from a “neutral” level to “fear”.
Currently, Bitcoin is trading around $91,000 (down approximately 1% over 24 hours), struggling not to yield under selling pressure. A striking fact highlighted by analysts is the growing correlation with Asian markets: BTC tends to climb during Asian sessions only to suffer brutal sell-offs as soon as US markets open, coinciding with ETF outflows.
Max Pain: Why Is Bitcoin Stuck at $90,000?
This Friday marks a major deadline for derivatives products. At 8:00 AM UTC, more than $2.2 billion in options contracts are set to expire. The phenomenon is visible to the naked eye on the charts: Bitcoin’s price seems magnetically drawn around $90,000, while Ethereum struggles around $3,100.
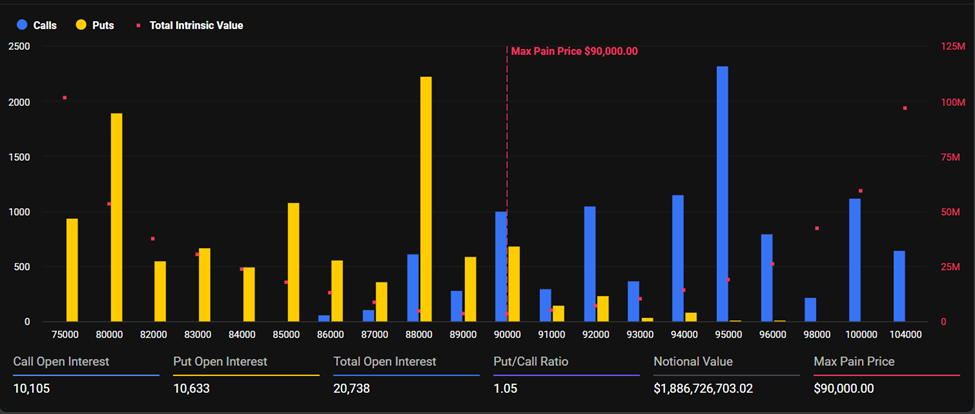
This is the classic “Max Pain” effect. It’s the price level where the majority of options (both Calls and Puts) expire worthless, maximizing profits for market makers at the expense of retail traders. Currently, Bitcoin’s Put/Call ratio stands at 1.05, signaling extreme caution and massive hedging by investors fearing a drop below key support levels.
For Ethereum, the dynamic is slightly different. With a Put/Call ratio of 0.89, sentiment remains moderately bullish. Traders appear to be betting on a faster recovery for ETH once this technical lock is broken, hoping to see the asset break free from the $3,100 resistance to restart the engine.
Technical Analysis: Critical Levels to Watch
Graphically, Bitcoin is walking a tightrope. The correction from the local peak of $94,700 has brought the price back to a major psychological and technical threshold. The $90,000 level is currently acting as the last line of defense before a more serious deterioration of the trend.
The key indicator to watch is the 50-day Moving Average (MA50), positioned precisely at $89,200. This is the line bulls cannot afford to lose:
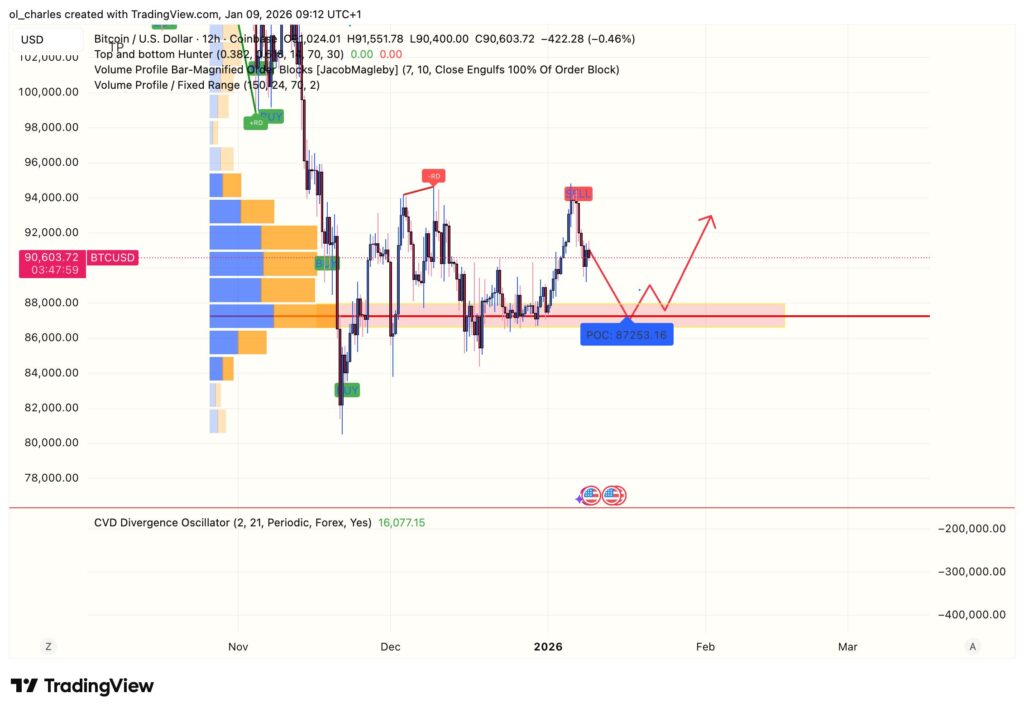
- Bullish Scenario: If the price manages to defend the $89,200 – $90,000 zone, a technical bounce toward the $94,000 – $96,000 resistance is the favored scenario.
- Bearish Scenario: A confirmed break (daily close) below $91,000 would open the trapdoor toward lower liquidity. The next major support levels are then at $87,000, or even $86,000 in the worst case in the same POC zone on the 12H timeframe.
Despite this grim short-term picture, on-chain data offers a glimmer of hope for patient investors. Selling pressure, materialized by profit-taking (Realized Profit), has significantly decreased compared to the end of last year, dropping from over a billion dollars per day to approximately $183 million. This consolidation above $80,000 could be healthy for building a solid base. And the $100,000 target remains more than probable.
Related Articles:

