

Sixth month in the red for Bitcoin
Currently trading around $66,734 (up approximately 1% over 24 hours), Bitcoin (BTC) is showing signs of weakness, moving away from its range high of $73,000. Furthermore, the asset is on track to close the month of March in the red, which would potentially mark its sixth consecutive month in negative territory.
The catalyst for this selling pressure stems directly from traditional finance. Yields on 10 year US Treasury bonds are dangerously approaching the 5% mark, driven by persistent inflation fueled by oil prices. Historically, such a surge in yields boosts the appeal of fixed income instruments, draining liquidity from speculative markets.
Between October 2021 and December 2022, a similar spike in yields coincided with a staggering plunge for Bitcoin, dropping from $67,000 to $16,256. If a confirmed breakout pushes rates toward 5%, the capital rotation out of risk assets could accelerate. This macroeconomic dynamic directly threatens the price of BTC in the short term.
Is Bitcoin’s key support in danger?
Faced with this macroeconomic threat, Bitcoin’s technical analysis reveals crucial levels to monitor closely. The 1 month range zone indicates a range high around $73,000, a middle of the range at $65,000, and a range low at $53,000. These 3 price levels will be crucial for the coming months.
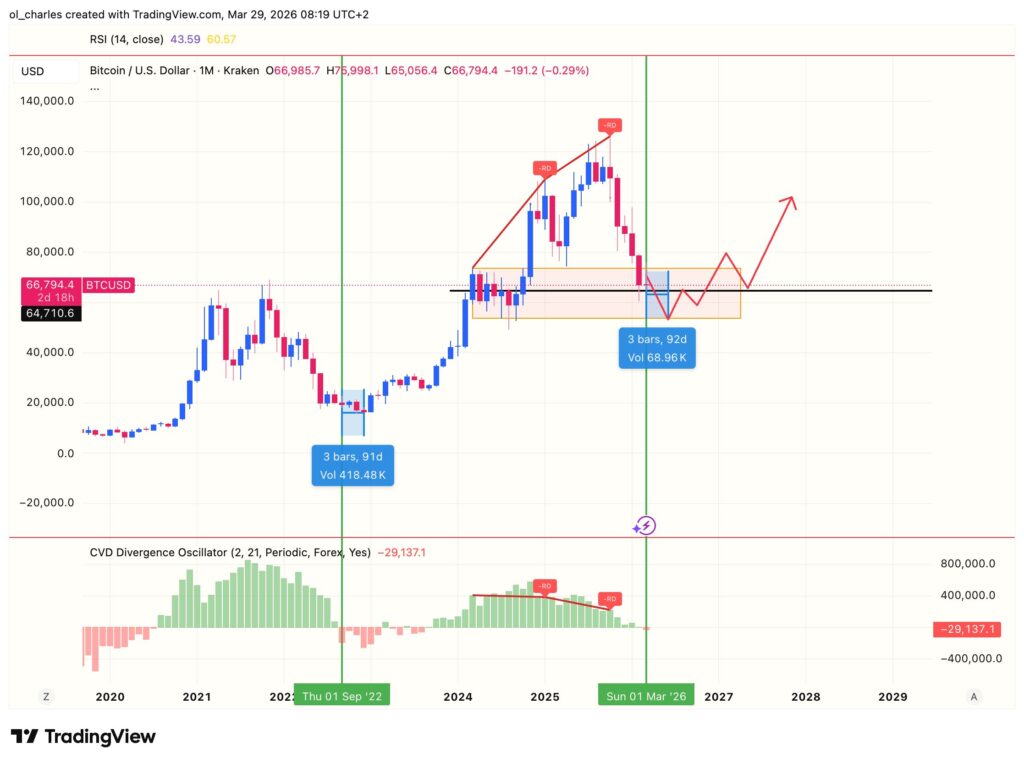
Furthermore, CVD analysis reveals that Bitcoin could bottom out in the next 3 months, around June or July. Indeed, when the monthly CVD reached the red zone in 2022, it took 90 days for Bitcoin to subsequently bottom. Bitcoin has just hit the red zone this March 2026, which could provide a bottom within the next 90 to 120 days.
In a bullish scenario, Bitcoin would need to absorb this macroeconomic shock and maintain its price above $65,000. A stabilization would pave the way for a rebound toward recent resistances, thereby reigniting the bull run momentum. However, caution remains warranted as long as uncertainty looms over inflation and US monetary policy decisions.
Is it a good time to buy Bitcoin?
The prospect of a drop toward $53,000 raises a crucial question for investors: does this decline represent a golden opportunity? Historically, deep correction zones have often served as a springboard to propel prices to new highs. If BTC reaches the $58,000 to $53,000 zone, many institutional players could view it as a massive strategic entry point.
Moreover, the trader Killa, who perfectly predicted Bitcoin’s last 300 days, is also targeting this $53,000 zone in the coming months. According to him, Bitcoin is expected to range and perform a bearish retest in the coming weeks before dropping lower. In short, Bitcoin could retest the $73,000 mark in the coming weeks and sustain itself above $65,000.
The market remains highly dependent on the decisions of the US Federal Reserve (Fed). Persistent inflation, fueled by rising oil prices, could delay any interest rate cuts. This tense macroeconomic environment forces traders to adopt strict risk management, closely monitoring trading volumes and liquidations in the derivatives market.
Furthermore, Bitcoin does not recover from a double monthly bearish CVD divergence in just a few weeks. Alternatively, it would take a massive catalyst to trigger a new wave of institutional inflows. We will also need to wait for the S&P 500 and the Nasdaq to find their bottoms, which should be around $5,700.
The upcoming months will be the best time to accumulate Bitcoin through DCA. Indeed, the zone between $65,000 and $53,000 appears to be an area where demand will exceed selling pressure.
Sources:
- X – KillaXBT – Kobeissi
- AMBCrypto
- Tradingview
Related Articles:

