

Whales Unload Positions While Retail Investors Accumulate
The current Bitcoin market dynamics perfectly illustrate the gap between retail investors and institutional players. Data from Binance shows that 72% of long exposure now comes from retail traders, convinced they’re buying the dip before an imminent rebound. This conviction often stems from BTC’s history of rapid corrections, where each drop represented a golden opportunity.
However, wallets containing more than 1,000 BTC tell a radically different story. On-chain metrics reveal net selling pressure estimated at 5 million BTC from these large holders over recent weeks. This massive distribution occurs precisely when retail sentiment becomes excessively optimistic—a familiar pattern that has preceded major corrections in the cycle.
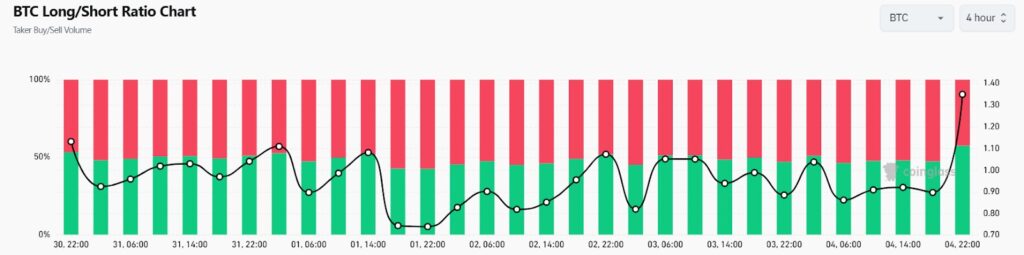
Analysis of volume dominated by whales currently shows 48% short positions versus 51.99% long positions. This near-parity actually conceals a pronounced bearish bias, as the average volume of short positions significantly exceeds that of long positions. Whales use this asymmetry to create liquidity pockets they subsequently exploit through coordinated selling, forcing stops and amplifying the downward movement.
This behavioral imbalance creates a perfect environment for cascading liquidations. When over-leveraged retail traders face margin calls, they involuntarily become counterparties to institutional short positions. This mechanism, observed during every major peak since 2017, transforms retail optimism into fuel for the descent.
Bitcoin’s Technical Structure Fractures Across Multiple Key Levels
From a technical standpoint, Bitcoin ‘s situation has deteriorated considerably in recent days. The breakdown of the $101,000 psychological support represents only the first stage in a series of concerning ruptures. Even more critical, BTC has lost its 20-day simple moving average, currently positioned at $109,700, transforming what was dynamic resistance into a ceiling now difficult to recapture.
The 14-day RSI displays 39.31, signaling oversold conditions without confirming an immediate reversal. This zone can persist for several weeks in a structural bear market, as observed in 2022. The MACD remains deeply negative at -1.269, with a histogram that continues to widen—evidence that selling pressure is accelerating rather than slowing.
Fibonacci retracements of the last bullish swing place the next major support around $98,000, corresponding to the 38.2% level. This threshold also coincides with the 2024 cycle low, creating a technical confluence that could attract institutional buyers seeking strategic entry points. However, a weekly close below this level would open the door to $92,000, the 50% retracement zone.
Trading volumes during the breakdown exceeded the 30-day moving average by 40%, confirming this is an impulsive move rather than simple consolidation. Liquidity clusters visible on order books show a significant concentration between $97,500 and $98,500, suggesting algorithms and market makers are actively targeting this zone for their next interventions.
On the same subject:

