

A Historic Liquidation That Reshuffles the Market Landscape
The numbers speak for themselves: $610 million in long positions were wiped from the XRP futures market during this liquidation cascade. This brutal deleveraging demonstrates widespread overconfidence among traders who had massively bet on price appreciation. The domino effect triggered when the price breached several critical stop-loss levels, causing a chain reaction typical of highly leveraged markets.
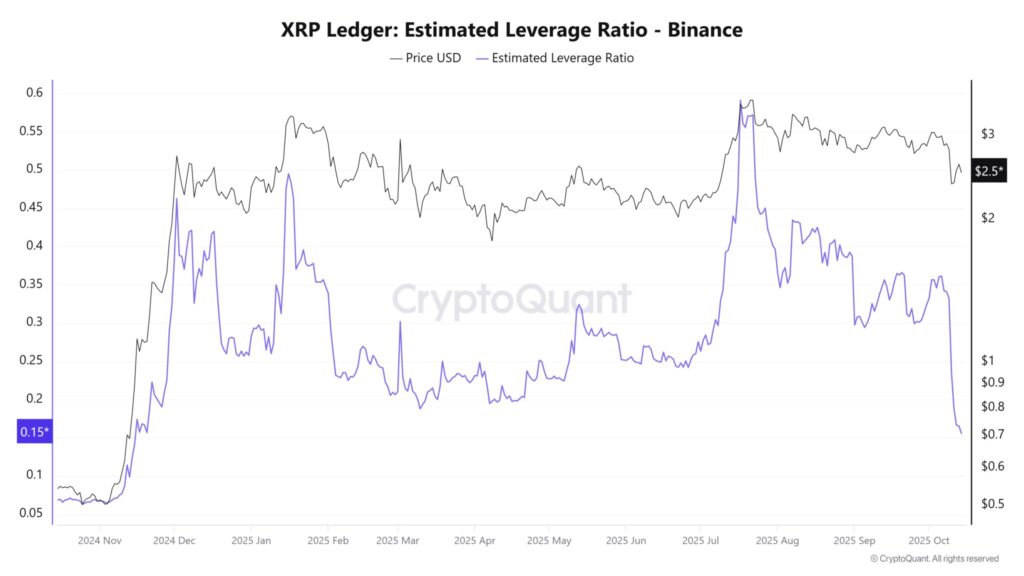
This market purge isn’t necessarily negative from a structural perspective. It helps clear out excessive speculative positions and reduces artificially inflated open interest. On-chain data shows that the funding rate, previously strongly positive, has normalized toward neutral levels. This technical reset paradoxically creates healthier conditions for a potential rebound once selling pressure has been fully absorbed.
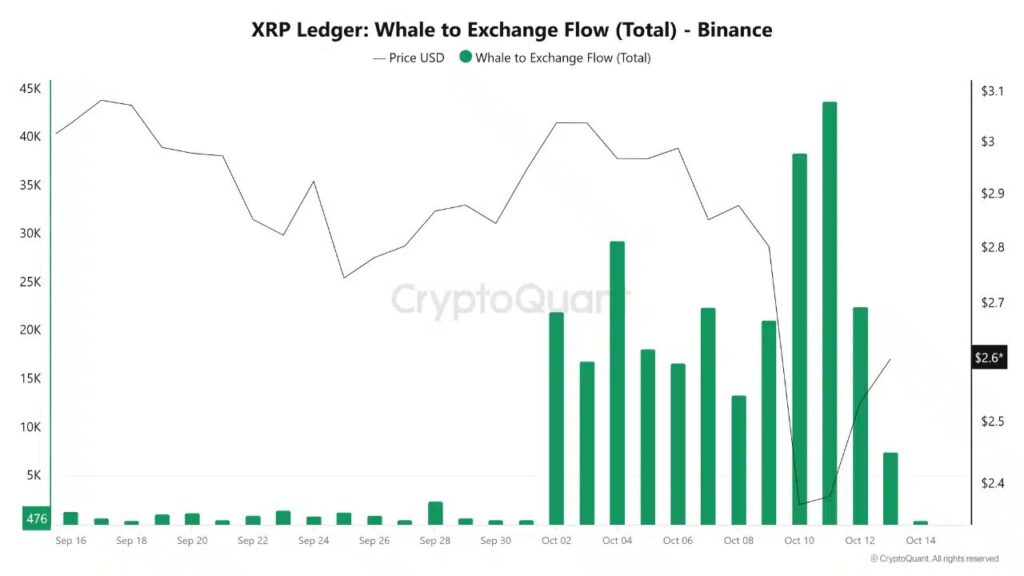
Market sentiment has shifted from euphoria to caution. Trading volumes exploded during the liquidation phase, signaling active participation but also extreme volatility. Seasoned traders know that these moments of maximum panic often represent opportunities—provided one can correctly identify support zones that truly hold.
🔥 Position Yourself on XRP Now?
Violent corrections like the one on October 10 have often preceded XRP’s strongest bullish phases. For those looking to position themselves at reduced prices before a potential rebound, Bitget offers an ideal entry point with a $10 bonus for all newly verified users.

The $3 Resistance: The Wall XRP Cannot Break Through
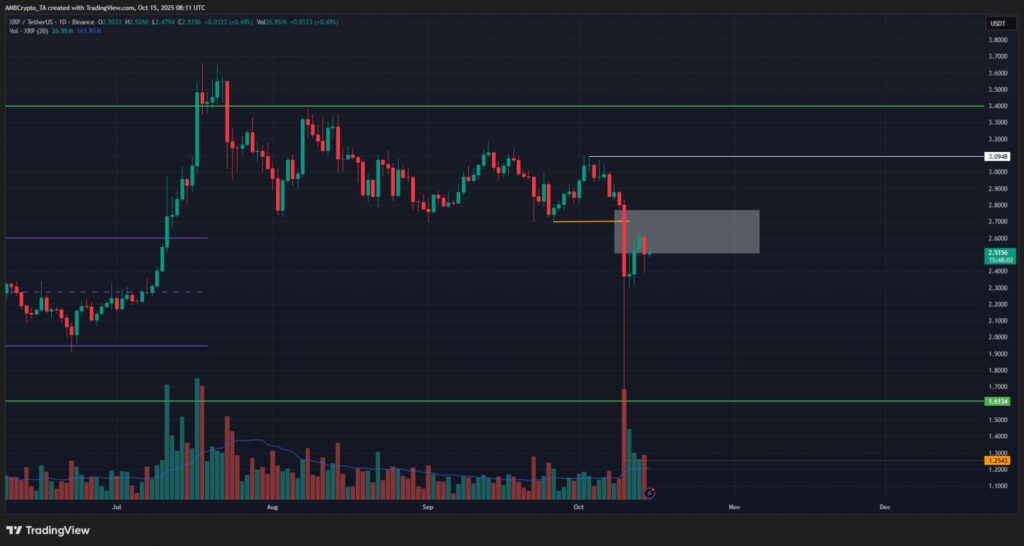
The psychological and technical $3 level currently represents XRP’s main obstacle. This price zone has already rejected several bullish attempts, accumulating a significant concentration of sell orders. Sellers are defending this resistance with determination, aware that a breakout above this threshold could trigger a significant rally toward higher peaks.
Technical analysis reveals several contradictory indicators. The RSI plunged into oversold territory during the liquidation, suggesting possible bearish exhaustion in the short term. However, the 50 and 200-day moving averages are beginning to converge dangerously, a signal often heralding significant directional movements. The question remains in which direction this accumulated energy will be released.
Key support levels to monitor are around $2.50 and $2.20. If the price breaks these zones with significant volume, it could open the door to a deeper correction. Conversely, a confirmed rebound with recovery of the $2.80 level might indicate that buyers are regaining control and preparing a new assault on the $3 resistance.
Fundamental Factors That Could Influence XRP’s Trajectory
Beyond technical analysis, several fundamental elements weigh on XRP’s price evolution. The regulatory context remains a major catalyst, with ongoing developments in the Ripple vs. SEC lawsuit. Each legal update has historically triggered significant price movements, creating uncertainty that markets despise.
The institutional adoption of RippleNet continues to progress despite price volatility. Several banking partnerships and cross-border payment initiatives maintain interest in the token’s real-world utility. This dichotomy between speculative price action and fundamental adoption creates a disconnect that some analysts consider a medium-term accumulation opportunity.
The correlation with Bitcoin and the general crypto market sentiment remains a determining factor. If BTC experiences a more pronounced correction, XRP would struggle to resist the general downward pressure. Savvy traders therefore keep a close eye on Bitcoin dominance and investment flows across the entire crypto ecosystem before taking aggressive positions.
Related topics:

