

The Crypto Market Under Pressure: Where Does Ethereum Stand?
The cryptocurrency market is facing a fresh wave of selling pressure following the brief recovery seen earlier this week. Ethereum hit a peak of $3,248 on December 4, 2024, before retracing to the current $3,018, posting a loss of over 4% in the last 24 hours.
This volatility is nothing unusual in a crypto market characterized by rapid fluctuations. However, behind this apparent pullback, an intriguing price structure is emerging that technical analysts are beginning to identify. Market sentiment remains temporarily bearish, but the charts tell a different story, one of a possible trend reversal on the horizon.
The current price zone represents a critical inflection point. Buyers and sellers are battling around the psychological level of $3,000, while the 50-day moving average reinforces this strategic technical support.
Buy your ETH before its explosion in just a few clicks with a bonus of up to $25 on the exchange Zoomex:
A Troubling Fractal Configuration: Ethereum Replicates Solana’s Pattern
The comparative analysis between Ethereum and Solana on the 4H timeframe reveals an almost identical sequence. SOL’s fractal pattern from October 2024 showed a double bottom, followed by a breakout above the neckline, then a retest of that support zone turned resistance, perfectly aligned with the 50-day MA. This pattern triggered a bullish progression of 23%.
Ethereum is now following this exact same technical trajectory. The asset has just broken through its double bottom neckline in the zone between $3,000 and $3,070. The price is currently making a pullback movement toward this region to retest it as new support, a classic bullish continuation configuration.
The technical confluence is particularly significant: this retest coincides precisely with the 50-day MA support located at $3,024. This convergence of technical levels creates a bullish confluence zone similar to the one that propelled Solana during its historic rally.
Outlook and Key Levels to Watch for ETH
If the current support zone between $3,000 and $3,070 holds and buyers effectively defend this neckline, Ethereum could target $3,500 in the short term. This scenario is likely given the liquidity present above the double top formation.
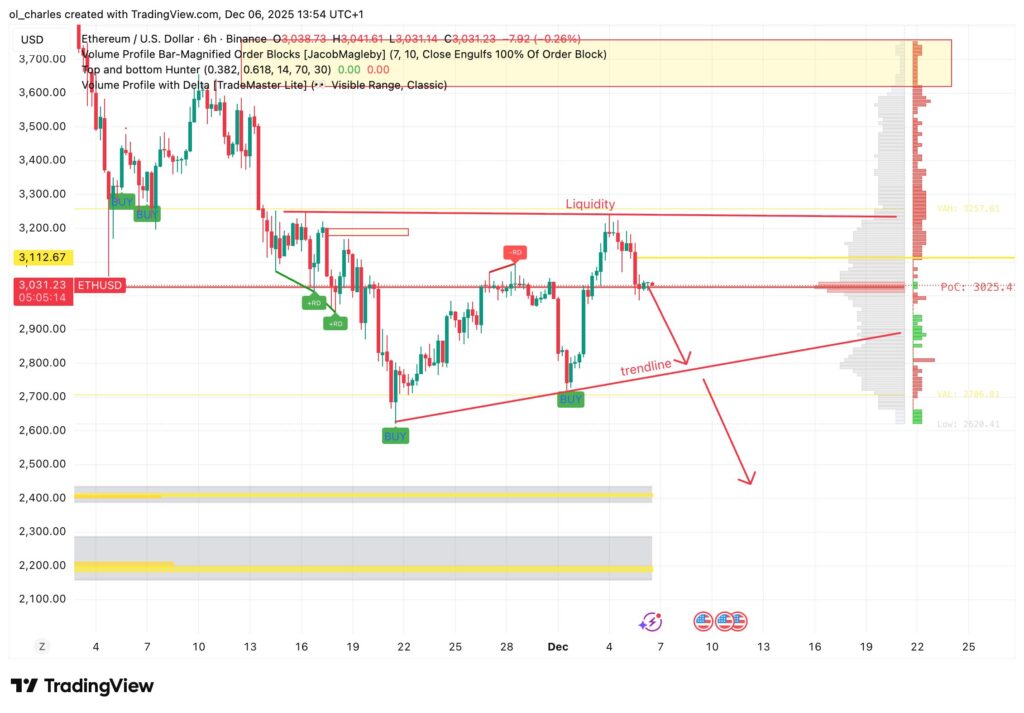
Conversely, a decisive 6-hour close below the POC level at $3,000 would weaken this fractal symmetry. Such a breakdown would invalidate the pattern and push ETH’s price to a minimum of $2,800.
In this scenario, a break of the bullish trendline would become increasingly likely, potentially pushing ETH into its next demand zone and Order Block at $2,400.
Trading volumes remain a crucial indicator to monitor. A defense of support accompanied by rising volumes would strengthen the probability of a bounce, while weak volumes would indicate a lack of buyer conviction. For now, the technical structure remains intact and the fractal pattern remains valid.
Related articles:

