

A Healthy Cleanup of the Futures Market
Currently, Ethereum is trading in the $3,100 – $3,140 zone, showing a slight correction over the last 24 hours. But don’t be fooled by this apparent lethargy. Beneath this trend, the derivatives market structure suggests a far more bullish underlying movement than it appears.
According to on-chain data, the estimated leverage ratio on Ether has dropped from its peak of 0.79 (on January 2) to 0.67 recently. Yet, the Open Interest continues to climb. In trading jargon, this divergence is an excellent sign: it indicates that traders are reopening positions, but with less excessive leverage. The market has “purged” itself of weak hands, drastically reducing the risk of a cascading long squeeze. This type of setup often precedes organic and sustainable movements.
Spot Demand Takes Over from Speculators
The other major catalyst identified on the charts is the behavior of the CVD (Cumulative Volume Delta) on the Spot market. Unlike fragile rallies driven solely by futures contracts, Ethereum’s recent momentum is supported by genuine spot buying pressure.
When the price rises accompanied by an increase in Spot CVD, it means that investors are actually accumulating the asset to hold it, not to speculate short-term. Moreover, the long/short ratio remains around 2.66, confirming a dominant bullish sentiment without falling into irrational euphoria. This silent accumulation is often the precursor to a violent breakout once resistance gives way.
Nevertheless, a bearish divergence in the CVD appeared on the 9-hour timeframe recently, for the first time since December 10, which had marked a local top for Ethereum.
Scenario: $4,000 or Back to Square One?
From a purely technical standpoint, the battle is being fought at precise levels. The support at $3,000 (also a POC) is currently acting as a fortress that bears are struggling to breach. As long as this level holds, the structure remains constructive.
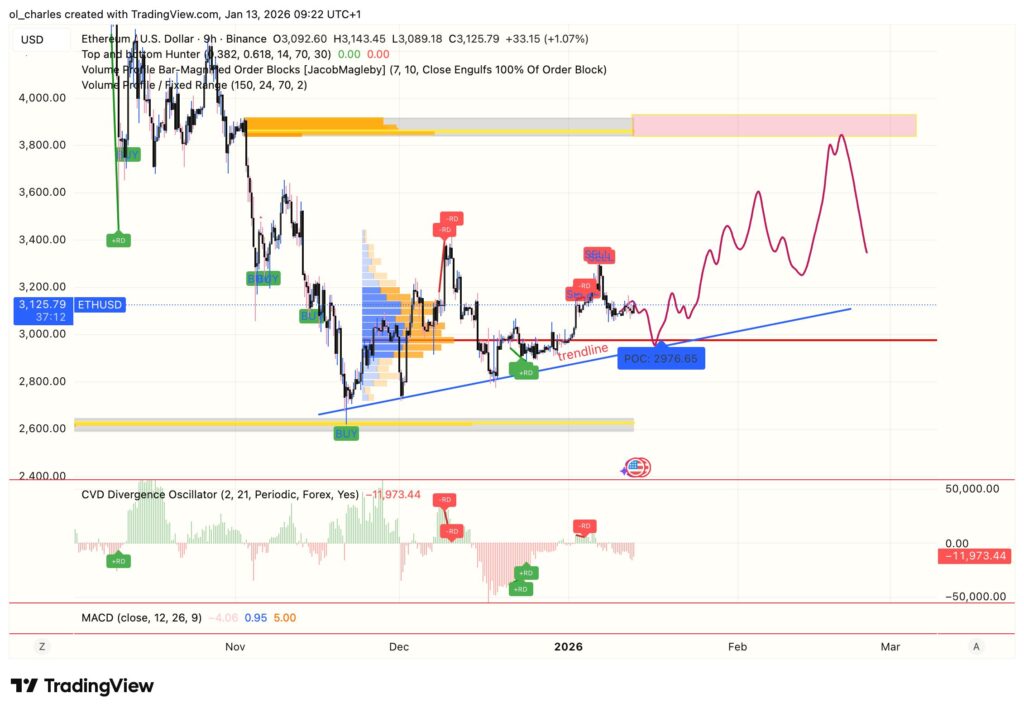
To validate the scenario of a surge toward the order block at $3,800, ETH must first break free from the intermediate friction zone around $3,300 – $3,500. If this lock breaks, accompanied by the maintenance of current Spot demand, the path to $3,800 would be technically clear.
Conversely, a loss of the $3,000 support would invalidate this thesis and could trigger a retest of lower zones. Indeed, a bullish trendline has been reinforced below its price. A break below this trendline and below the POC would be a bad omen for ETH.
With cleaned-up leverage indicators and visible Spot accumulation, has Ethereum finally gathered enough energy to smash through its yearly resistance? The answer in the coming weeks.
Related Articles:

