Exploring Why Litecoin (LTC) Could Skyrocket Similar to BNB
While the focus remains on BNB and Solana, Litecoin (LTC) is catching analysts' eyes with a cup-and-handle pattern forming on daily charts. With increasing volume and a modestly bullish RSI, LTC could be the next big breakout in the market.
The Litecoin Cup-and-Handle Pattern: A BNB Replica?
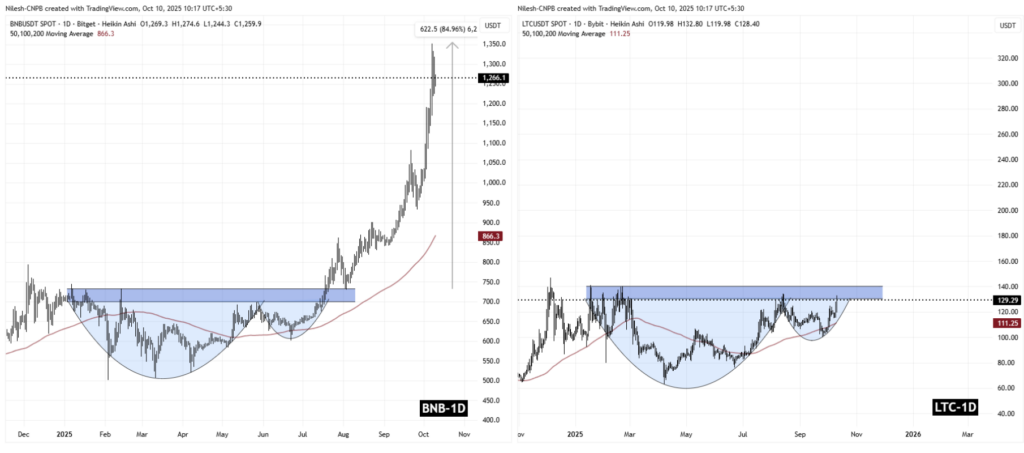
Comparative analysis of daily charts reveals an almost identical structure between BNB and LTC. At the end of July 2025, Binance Coin completed a cup-and-handle formation, triggering a spectacular 84% surge. The token moved from its breakout zone around $730 to reach an ATH close to $1,352.
Litecoin is currently drawing the same technical configuration. The “cup” has formed, and the “handle” is in a consolidation phase. The price is now approaching its major resistance located between $130 and $140, a critical zone corresponding to the pattern’s neckline. This region resembles BNB’s pre-breakout consolidation phase, suggesting accumulation is underway.
Trading volumes accompany this construction. The gradual decrease in volume during handle formation is a classic signal that often precedes volatility expansion. Savvy traders are closely monitoring price behavior in this resistance zone, as a confirmed breakout would validate the entire bullish setup.
The history of fractal patterns in the crypto market shows that these structural repetitions offer interesting probabilities. However, they never guarantee the outcome. The current macroeconomic context, with a renewed interest in established altcoins, could favor the complete realization of this configuration.
Target $217: What’s the Probability?
If the fractal plays out completely, the next technical target sits around $217. This represents a 67% upside potential from current levels, a gain that would place Litecoin among the best performers of this altcoin cycle. However, several conditions must be met to validate this scenario.
The key level remains the $140 threshold. A clean breakout above this resistance, accompanied by significant volume, would constitute the entry signal for many technical traders. Ideally, this breakout should be followed by a retest of the zone, transforming the former resistance into support. This validation process is crucial to avoid false breakouts that regularly trap impatient traders.
On-chain indicators provide additional insight. Whale activity on the Litecoin network has increased in recent weeks, with significant transactions suggesting discreet accumulation. The ratio of long positions on leveraged trading platforms also shows growing interest in LTC.
Nevertheless, several factors could disrupt this ideal scenario. General crypto market conditions, institutional liquidity flows, and overall investor sentiment all play decisive roles. A sharp correction in Bitcoin could temporarily invalidate this setup, even if the technical structure remains intact. Stop-losses should be strategically positioned below major support levels to manage risk.
LTC Benefits from Renewed Interest in “Store of Value” Blockchains
Beyond the fractal pattern, several technical elements strengthen the bullish thesis on Litecoin. The 200-day moving average, an absolute reference for medium to long-term investors, recently crossed above the 50-day moving average. This golden cross constitutes a classic bullish signal that often attracts institutional capital.
The daily RSI maintains a neutral zone between 50 and 60, leaving comfortable margin before reaching overbought territory. This configuration allows for potential movement extension without immediate risk of technical correction. Bollinger Bands are also beginning to tighten, a phenomenon that typically precedes volatility expansion.
The open interest on Litecoin futures contracts has increased by 23% over the past two weeks. This increased positioning in derivatives demonstrates growing conviction among professional traders. The funding rate remains slightly positive without reaching extreme levels, a sign of measured optimism that leaves room for bullish continuation.
Passionate about the crypto world, he explores the blockchain ecosystem to extract the most essential insights. With his expertise in SEO and web writing, he transforms news and technical analysis into clear, engaging, and impactful content. His goal? To help investors better understand the opportunities and challenges of the crypto market.
DISCLAIMER
This article is for informational purposes only and should not be considered as investment advice. Some of the partners featured on this site may not be regulated in your country. It is your responsibility to verify the compliance of these services with local regulations before using them.
DISCLAIMER
This article is for informational purposes only and should not be considered as investment advice. Trading cryptocurrencies involves risks, and it is important not to invest more than you can afford to lose.
InvestX is not responsible for the quality of the products or services presented on this page and cannot be held liable, directly or indirectly, for any damage or loss caused by the use of any product or service featured in this article. Investments in crypto assets are inherently risky; readers should conduct their own research before taking any action and invest only within their financial means. This article does not constitute investment advice.
Risk Warning : Trading financial instruments and/or cryptocurrencies carries a high level of risk, including the possibility of losing all or part of your investment. It may not be suitable for all investors. Cryptocurrency prices are highly volatile and can be influenced by external factors such as financial, regulatory, or political events. Margin trading increases financial risks.
CFDs (Contracts for Difference) are complex instruments with a high risk of rapid capital loss due to leverage. Between 74% and 89% of retail investor accounts lose money when trading CFDs. You should assess whether you understand how CFDs work and whether you can afford to take the high risk of losing your money.
Before engaging in financial or cryptocurrency trading, you must be fully informed about the associated risks and fees, carefully evaluate your investment objectives, level of experience, and risk tolerance, and seek professional advice if needed. InvestX.fr and the InvestX application may provide general market commentary, which does not constitute investment advice and should not be interpreted as such. Please consult an independent financial advisor for any investment-related questions. InvestX.fr disclaims any liability for errors, misinvestments, inaccuracies, or omissions and does not guarantee the accuracy or completeness of the information, texts, graphics, links, or other materials provided.
Some of the partners featured on this site may not be regulated in your country. It is your responsibility to verify the compliance of these services with local regulations before using them.
Get 6200 USDT with Bitget ! 🔥
Don't miss out on this offer !
Create your account now to unlock this exclusive reward