

HBAR Trapped by Maximum Correlation with Bitcoin
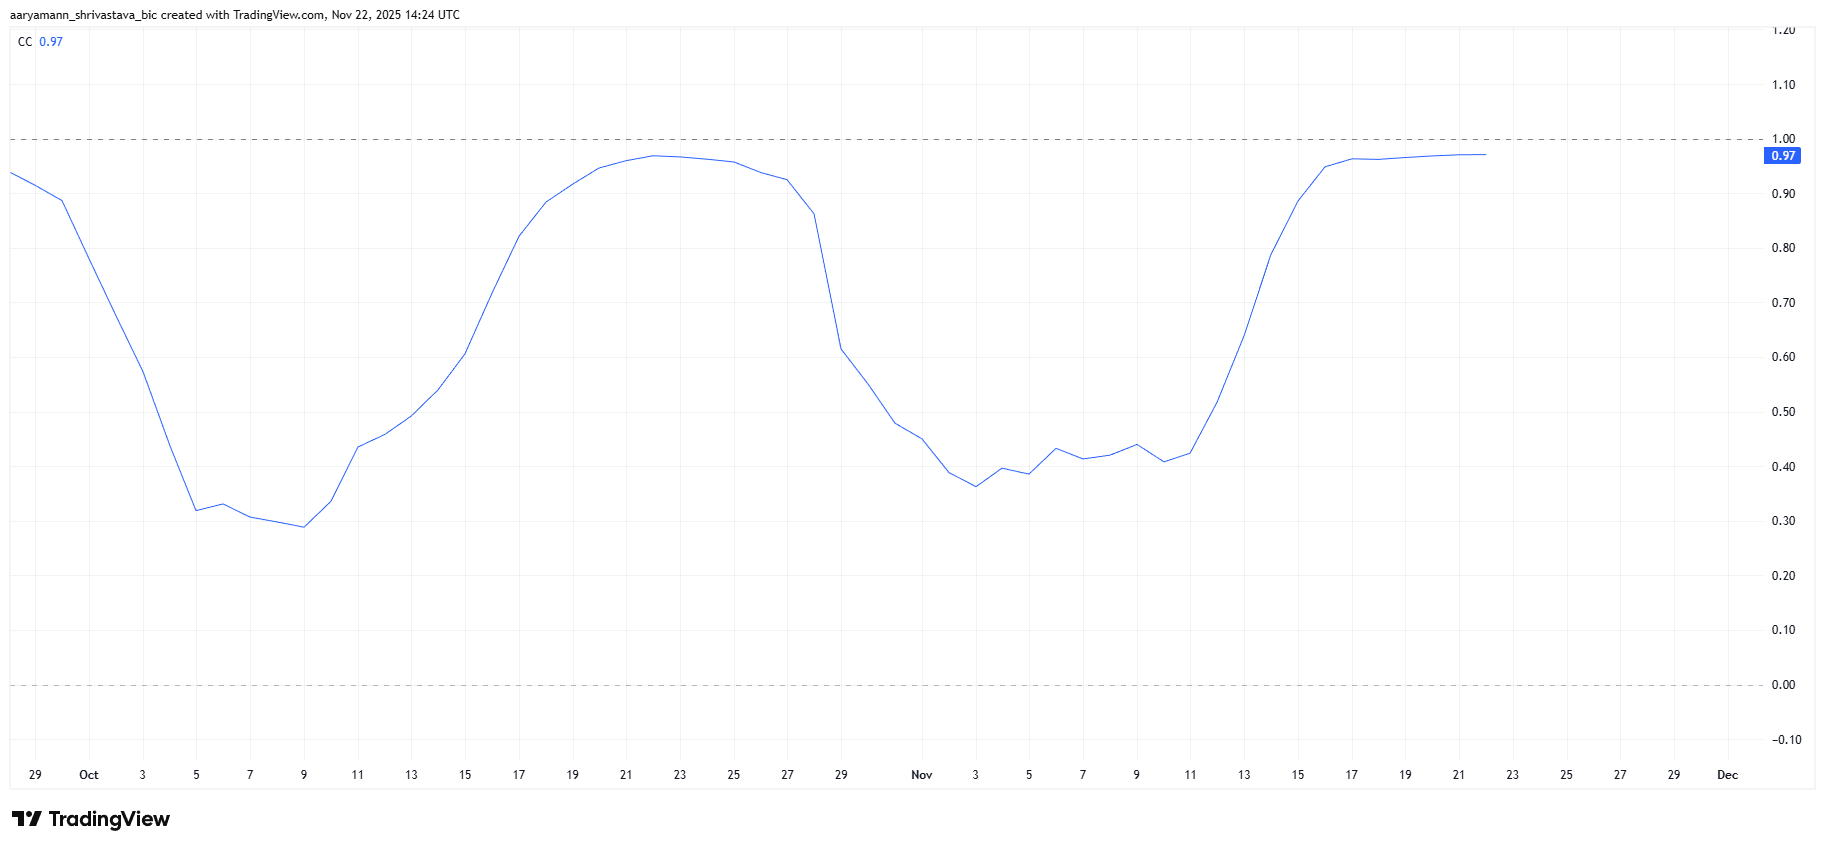
The current situation of Hedera perfectly illustrates the risks associated with excessive correlation with Bitcoin. With a correlation coefficient of 0.97, HBAR displays one of its highest dependencies on the king of crypto in several months. This near-perfect synchronization means that every BTC movement directly impacts the price of HBAR, practically eliminating any autonomy for the altcoin.
This situation becomes particularly problematic when Bitcoin goes through turbulent phases. The recent drop of BTC to $84,408 mechanically dragged HBAR down in its wake. Investors hoping to see the altcoin decouple during correction phases find themselves disappointed, as the strong correlation transforms HBAR into a simple Bitcoin proxy.
This dynamic poses a major challenge for Hedera’s independent valuation. Despite technological developments and the growing adoption of its network, the market continues to treat HBAR as a beta asset rather than a project with its own fundamentals. This reality complicates the task for traders seeking to anticipate movements based on project-specific analysis.
Capital Flows Confirm Bearish Pressure
Beyond the correlation with Bitcoin, on-chain indicators reveal a worrying deterioration in HBAR’s market structure. The Chaikin Money Flow is currently near an eight-month low, signaling massive and sustained capital outflows. This indicator, which measures the balance between buying and selling pressure, shows deeply negative readings that testify to accelerated investor disengagement.
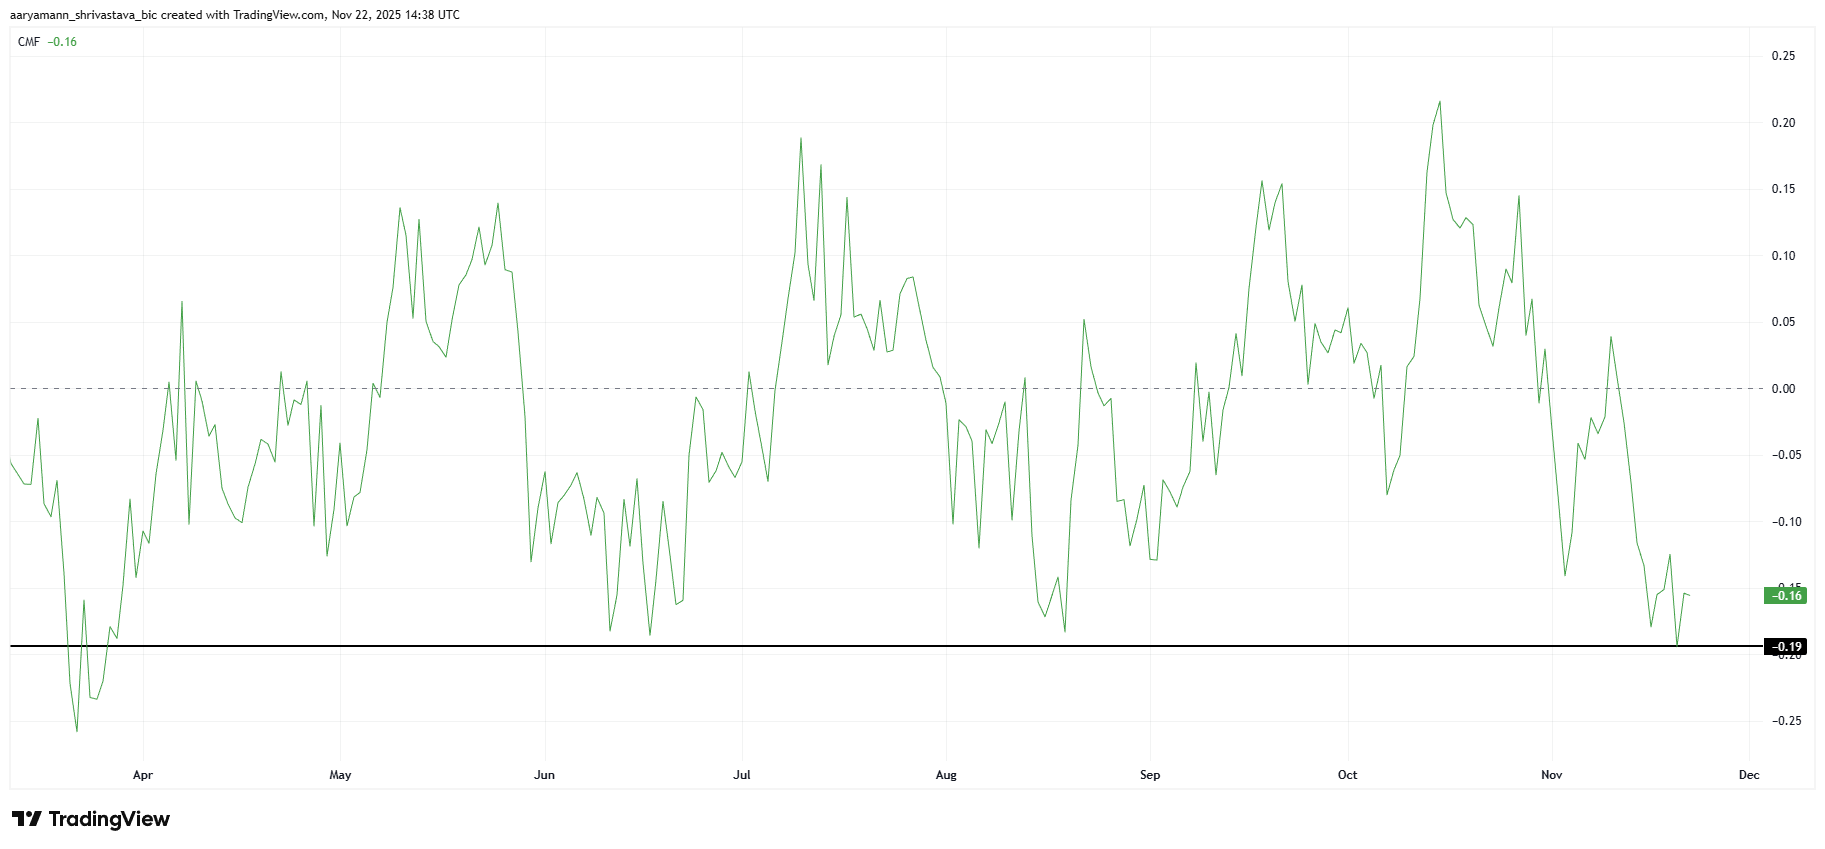
These persistent outflows create a vicious cycle where declining liquidity amplifies volatility and discourages new buyers. Without a return of incoming flows, technical rebound attempts remain fragile and are easily absorbed by sellers. This dynamic explains why HBAR struggles to reclaim lost levels despite occasional oversold conditions.
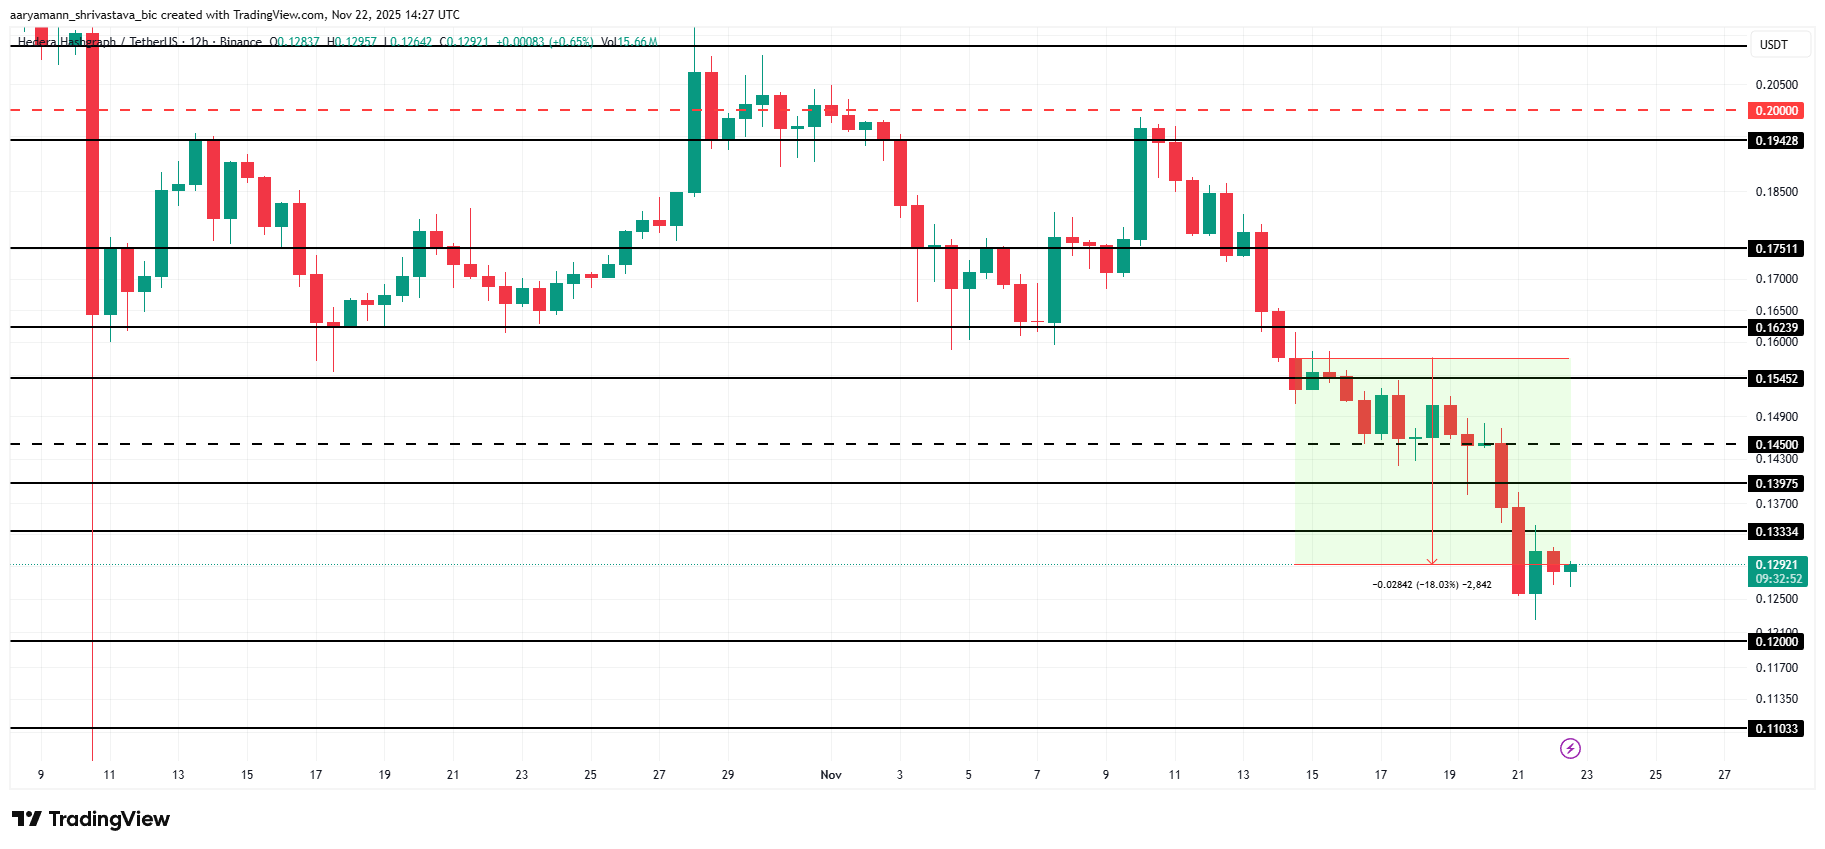
The combination of capital outflows and high correlation with Bitcoin places HBAR in a defensive position. Traders are now monitoring the $0.120 level as the next potential support. A break below this threshold could accelerate the correction toward $0.110, a zone where value buyers might intervene. Conversely, a recovery above $0.133 would constitute the first stabilization signal, opening the path toward $0.145 and then $0.154 if bullish momentum is confirmed.
Related Topics:

