

Is Hyperliquid Gearing Up for Its Next Surge?
Hyperliquid is establishing itself as a major player in DeFi. Currently, the price of HYPE is hovering around $39.70, posting an increase of about 4% over the last 24 hours. Trading volume is nearing $170 million, reflecting sustained investor interest.
Hyperliquid’s current strength relies on two key factors. First, the massive adoption of its non crypto assets (HIP 3), allowing users to trade gold, silver and oil directly on chain. Second, its growing integration with third party applications, generating colossal revenue. Notably, 97% of this revenue is allocated to a token buyback program, creating constant buying pressure.
Is the Key Support for Hyperliquid (HYPE) in Danger?
From a technical standpoint, HYPE is facing its largest resistance zone. Indeed, two order blocks are located above its current price, with a massive liquidity pool between $48 and $49. The $38 to $39 level is currently acting as a crucial immediate support. As highlighted in the initial analysis, the next move for HYPE will depend on the ability of buyers to maintain this pressure should this support begin to weaken.
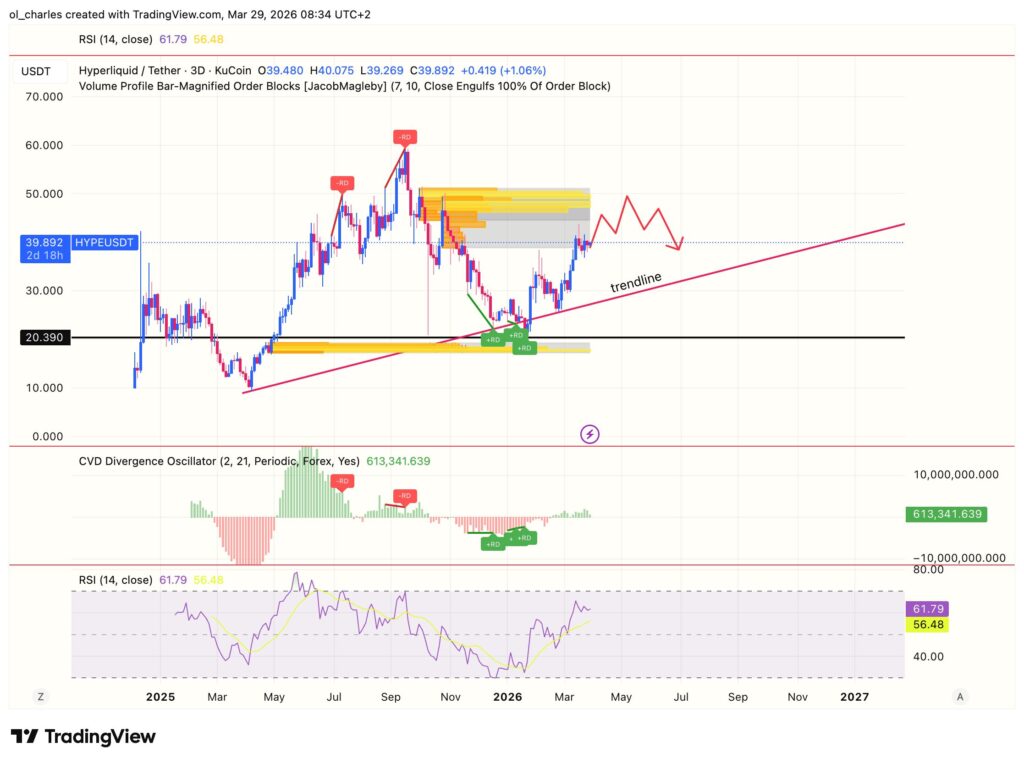
Indicators point to a fierce battle. The RSI is hovering near the oversold territory, while the CVD is green on the 3 day timeframe. A medium term bearish reversal is therefore highly probable in the coming months. This is especially true given that a major bullish trendline needs to be liquidated to the downside.
However, on chain data reveals that whales continue to accumulate during dips. Recently, massive long positions have been opened, suggesting that large wallets are anticipating an imminent bounce rather than a prolonged retracement. A short term surge toward this confluence zone around $49 is therefore quite likely.
Can HYPE Reignite a Rally and Smash Through $50?
If the bullish scenario is confirmed, the momentum could quickly shift. To validate a new rally, HYPE must absolutely break through the $51.70 resistance. This level is a high protected by smart money. If smart money fails to defend it, it means buyers are clearly dominating the market and HYPE will push for a new ATH.
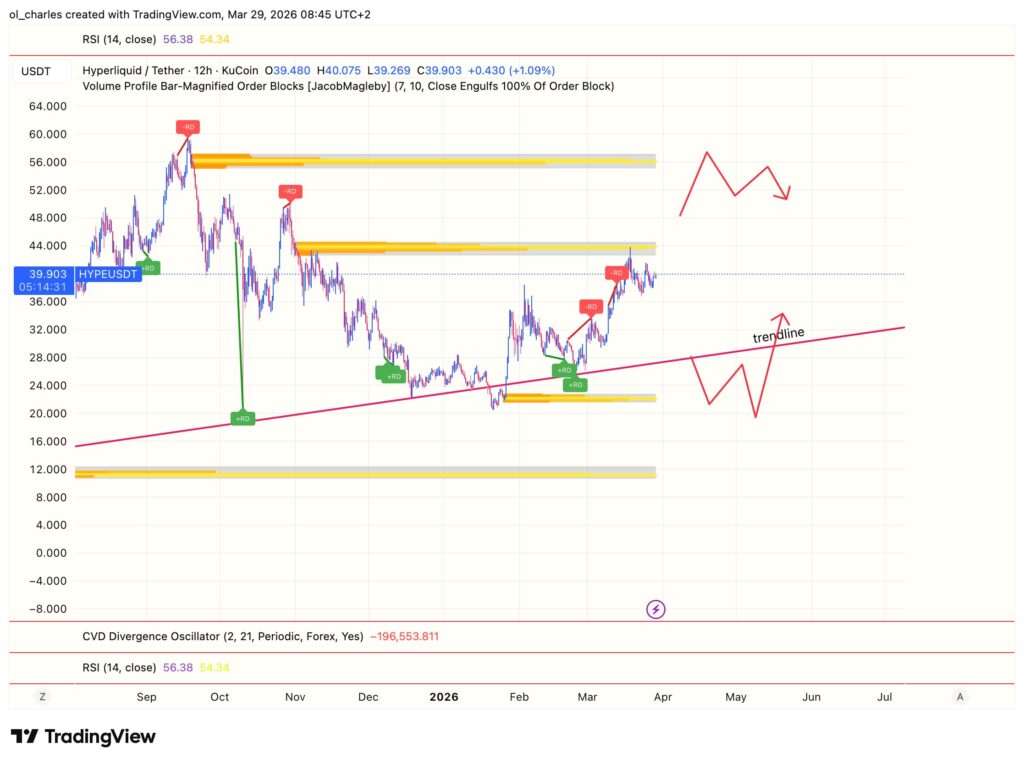
Once this psychological and technical barrier is cleared, HYPE will have its sights set on the zone near its ATH at $57.30. The enthusiasm surrounding decentralized perpetual markets and the constant token buybacks strongly support this bullish outlook.
Conversely, in a bearish scenario, a sharp rejection below $44 or at $49 would confirm a medium term downtrend. Traders will need to closely monitor trading volumes to confirm the direction of the next impulse and avoid fakeouts.
Is Now the Right Time to Accumulate HYPE Before the Next Breakout?
The crypto market remains unpredictable, but the fundamentals of Hyperliquid have never been stronger. With a market capitalization approaching $10 billion, the project is proving that it is no longer just an underdog, but a direct competitor to centralized trading giants.
HYPE has been dominating all altcoins since the beginning of the year. It is one of the safest bets among altcoins. Furthermore, its fundamentals have never performed better. In the event of a retracement, the $21 zone could present an opportunity to reload on HYPE tokens. Given the resistance levels HYPE is currently facing, there is no need to FOMO and patience will be key. A DCA strategy allows investors to optimize purchases and smooth out this volatility.
As the price consolidates, the coming days will be decisive. Will investors be able to defend key support levels to propel HYPE to new heights, or will we witness a flush of long positions? Volatility is likely to intensify very soon.
Sources:
Related Articles:

