

HYPE’s Fractal Pattern: A Historical Precedent That Speaks Volumes
In the current bearish context, Hyperliquid (HYPE), the native token of the decentralized exchange of the same name, has been particularly hard hit with a correction of over 9%. However, beyond this immediate volatility, longer-term technical analysis reveals the emergence of a promising structure. A configuration that bears a striking resemblance to the one SUI followed before its major rally, sparking interest among technical traders.
The comparative analysis between SUI and HYPE highlights remarkable structural similarities. In SUI’s case, the price had formed a characteristic rounded bottom before beginning a powerful expansion phase. This bullish dynamic ultimately ended with a well-defined rounded top, followed by a bearish consolidation marked by a moving average crossover.
Historical data shows that SUI completed its bearish moving average crossover approximately 47 days after its peak. The formation of a sustainable macro bottom then required roughly 91 days from the cycle peak. This bottom materialized in a strong demand zone between $1.70 and $2.15, which subsequently served as a launching pad for the next bullish phase.
HYPE is currently replicating this pattern with troubling precision. Since its recent peak, the token has recorded a bearish moving average crossover in just 45 days, virtually identical timing to SUI. Applying this fractal symmetry and allowing for a two-day variance, HYPE could now be approaching the final stages of its corrective phase, with the current drop nearing the bottom formation window estimated at 89 days from the peak.
Critical Support Zone and Key Levels to Watch for HYPE
Currently, HYPE has managed to bounce within the previous range and a significant demand zone. If HYPE holds above $27, it has every chance of reaching $34 in the coming weeks. Nevertheless, the resistance at $30 is crucial and has, for now, kept HYPE’s price trapped in this bearish spiral.
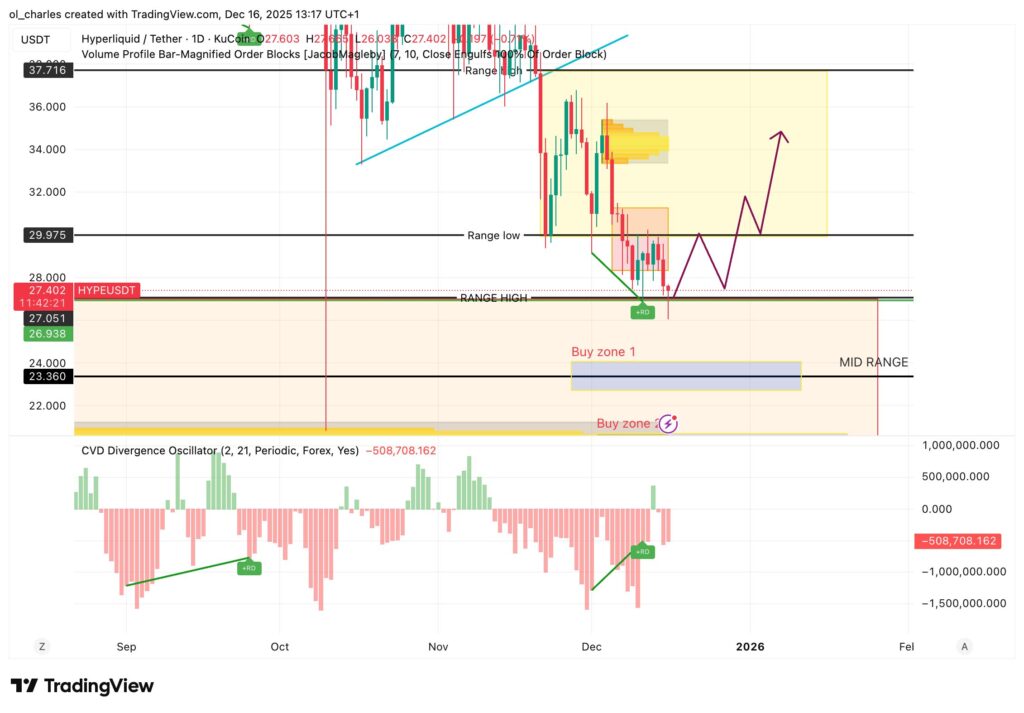
The most significant technical confirmation would come, however, from a successful reclaim of the 50-day moving average, currently positioned around $36.09. A sustained breakout above this level would validate the momentum shift and confirm the relevance of the fractal thesis, potentially paving the way for a more ambitious recovery phase.
Experienced traders are also scrutinizing volume behavior in this critical zone. A bounce accompanied by increased buying volume would strengthen the probability of a sustained reversal. Conversely, a breakdown below $25 with high volume would invalidate the fractal scenario and could trigger a deeper correction toward $23.6 or $21-$19.
It should be noted that this technical configuration in no way guarantees that HYPE will replicate SUI’s trajectory identically. Crypto markets remain inherently unpredictable and subject to multiple external factors. Nevertheless, the similarities in terms of structure, timing, and moving average behavior constitute technical indicators that are difficult for chartists to ignore.
While volatility remains elevated across the entire market, the upcoming trading sessions promise to be decisive. HYPE’s behavior around the $25-$26 zone could well define the token’s trajectory for the coming weeks and confirm or invalidate this emerging bullish fractal configuration.
Related articles:

