

Jupiter : an Endless Fall
The Jupiter (JUP) token is experiencing a crisis period, with increasing downward pressure on the markets. While the JUP price is currently trading at $0.4002, down by 19.13%, technical indicators are signaling a marked corrective phase.
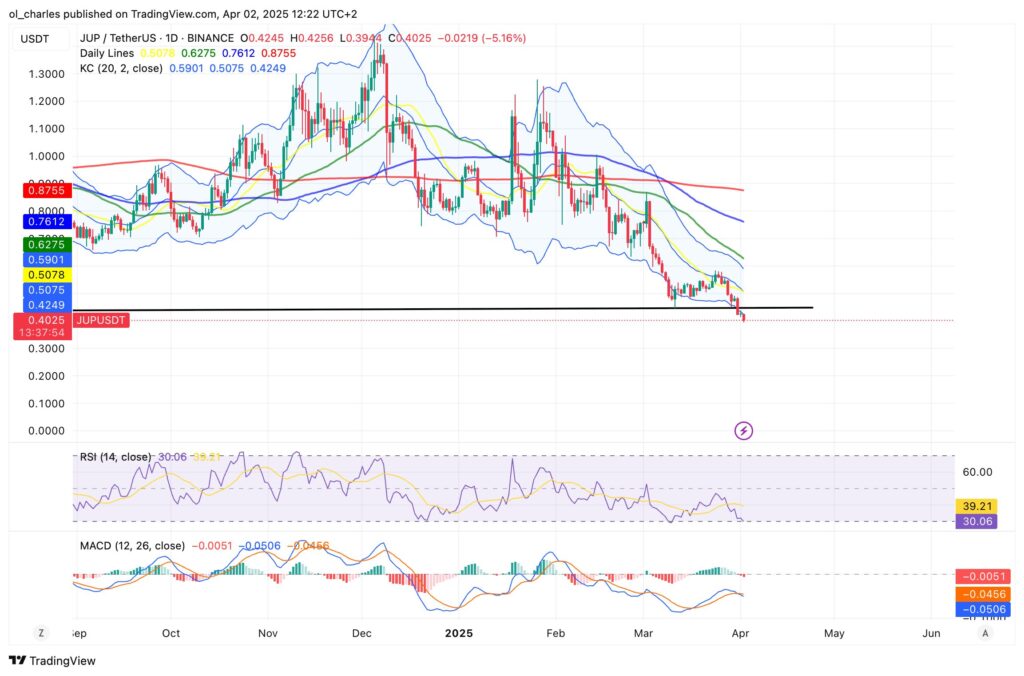
Indeed, JUP has broken one of its most significant supports at $0.45. Now, the token seems to be heading for a free fall. So, can it bounce back?
This fall comes at a time when the crypto market is currently characterized by widespread uncertainty, and JUP is not exempt from this dynamic. According to recent data, the token has experienced a sharp break of support levels, confirming increased selling pressure. Consequently, JUP is struggling to recover and has just hit a low of $0.29.
Data shows that JUP is in a corrective phase, but the question remains whether this correction will turn into a deeper fall or if a rebound is on the horizon.
Technical Analysis
Technical indicators confirm the current bearish trend of $JUP, but they also suggest signs of a possible trend exhaustion.
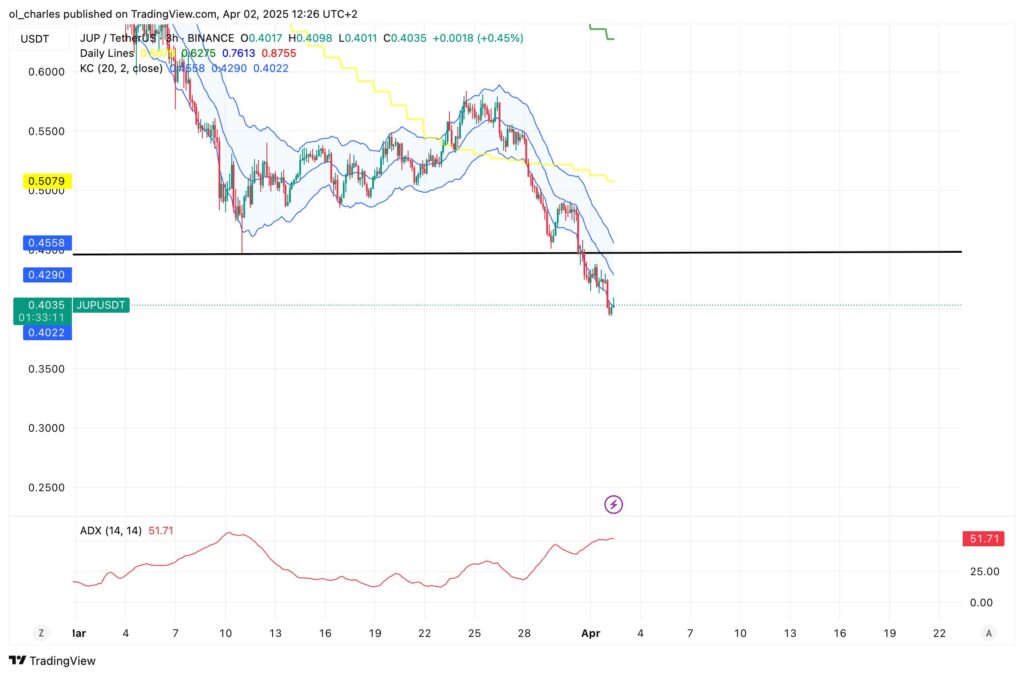
Firstly, the ADX (Average Directional Index) shows a high value of 100, indicating a strong directional force in the bearish trend. Coupled with a significant gap in the DMI (Directional Movement Index), this suggests that sellers overwhelmingly dominate the market. However, such a high ADX can also signal a potential exhaustion of the trend, especially if the price nears oversold conditions.
Secondly, the RSI (Relative Strength Index) is close to oversold territory. In fact, the RSI is at 33.70. This indicates that $JUP may be approaching a short-term bottom, which could attract opportunistic buyers looking for a rebound.
Thirdly, the analysis of the MACD (Moving Average Convergence Divergence) shows a bearish crossover with minimal divergence, confirming the continuation of the downtrend. This reinforces the idea that sellers maintain their grip on the market.
Lastly, the width of the Bollinger Bands, measured at 37.64%, indicates significant volatility. This margin suggests that $JUP could continue to experience significant price movements in the coming days, whether downward or during a potential rebound.
Key Levels to Watch for JUP
Supports to Defend
- Immediate Support (S1): $0.3984 – This level is currently being tested. A break below could accelerate the fall.
- Critical Support Zone: Between $0.3984 and $0.3765 – If this support zone gives way, $JUP could plunge to even lower levels, potentially around $0.35.
Resistance to Reconquer
- Main Resistance (R1): $0.4639 – A bullish recovery would require reclaiming this level to signal a trend change.
- Next Bullish Target: If JUP manages to surpass $0.4639, a return to $0.50 could be conceivable in the medium term.
The End of Jupiter?
$JUP, as a key token in the Solana ecosystem, is also affected by wider weaknesses in this network. Recent analyses on TradingView indicate that Solana shows signs of fragility, which weigh on associated tokens like Jupiter. Moreover, Solana’s Total Value Locked (TVL) has recently decreased, which could further increase pressure on $JUP and other ecosystem projects.
Jupiter may also be facing competition from newcomers like Pump Swap or the rise of Raydium. They are also affected by memecoins’ pitfalls and dubious launches like the LIBRA memecoin.
However, the volume ratio at 1.34x shows above-average trading activity. An increase in buying volumes could signal a reversal, while a continuation of selling volumes would confirm the bearish trend.
In the worst-case scenario, if $JUP breaks the critical support at $0.3765, a drop to $0.35 or even $0.20 cannot be ruled out, especially if market uncertainty persists in the crypto market. Conversely, a rebound from current levels could bring the token back towards the resistance of $0.4639, or even $0.50 in the longer term.
$JUP is at a turning point. The next few days will be crucial in determining whether the token can find solid support or if it will sink further into its corrective phase. Traders must remain vigilant and closely monitor key technical indicators and price levels.

