NEAR Protocol surges 11%: Key levels to watch
NEAR Protocol jumps 11%! Explore our technical analysis, key support & resistance levels, and potential price scenarios for NEAR. Click to learn more!


NEAR Protocol jumps 11%! Explore our technical analysis, key support & resistance levels, and potential price scenarios for NEAR. Click to learn more!
The NEAR token is currently trading around $1.60, consolidating a staggering 11% surge over the past day. This breakout is no coincidence but rather the convergence of exceptional on-chain metrics. Network activity has literally exploded, reaching an all-time high of 209 million transactions, confirming the massive adoption of the blockchain.
At the same time, the number of token holders has smashed a new ATH by crossing the 11,720 wallets milestone. This enthusiasm is also reflected in NEAR’s positioning within the AI category, where its $2 billion market capitalization is attracting the attention of both institutional and retail investors.
Community confidence is also at an absolute peak. A recent survey of over 147,500 participants reveals that 94% of them anticipate a continuation of the bull run. This ultra-positive sentiment creates fertile ground for future gains, provided the broader market dynamics remain favorable. Bulls are buying every dip in the AI stock market.
The impact of this movement is clearly visible in the derivatives market. Open Interest (OI) recorded a spectacular 20% jump in just 24 hours, peaking at $300 million. Notably, $60 million in new long positions have been opened, proving that traders are betting heavily on a bullish continuation.
OI-weighted funding rate data confirms this trend, showing that buyers are largely dominating the market. On the spot market, the dynamics validate this momentum. Net exchange flows show consistent capital inflows for four consecutive days, reducing selling pressure and strengthening the current support.
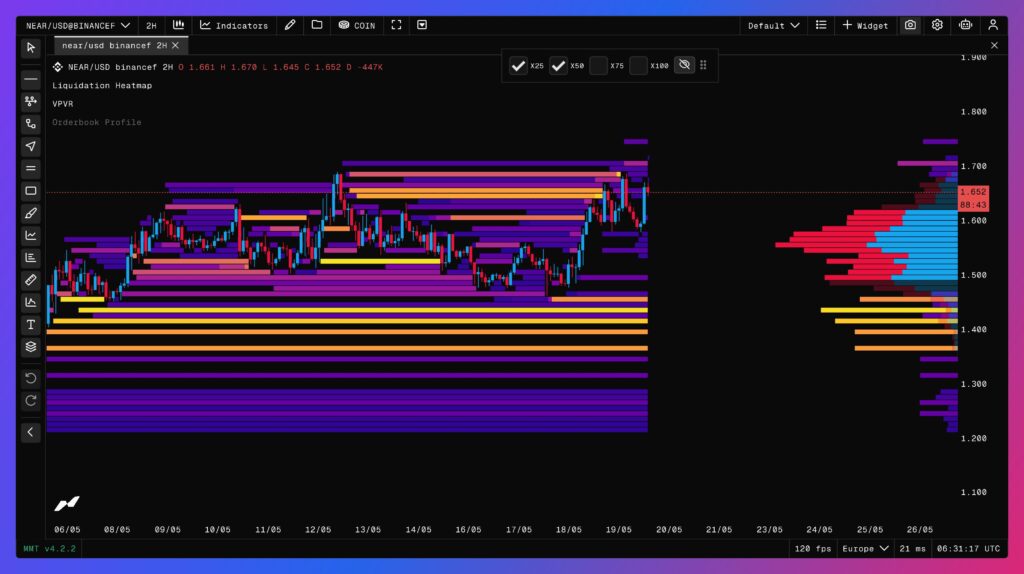
From a technical analysis perspective, this aggressive accumulation suggests that a major breakout is being validated. On the flip side, the liquidation heatmap indicates major clusters of longs to be liquidated down to $1.37. Whether in the coming days or months, this zone has a high probability of being tested before a major bounce toward $2.
In a bullish scenario, the current buying pressure and influx of liquidity could propel NEAR toward the next resistance levels. If the immediate resistance breaks under the weight of the $60 million in new longs, the token could trigger an even more violent rally, liquidating the remaining short positions along the way.
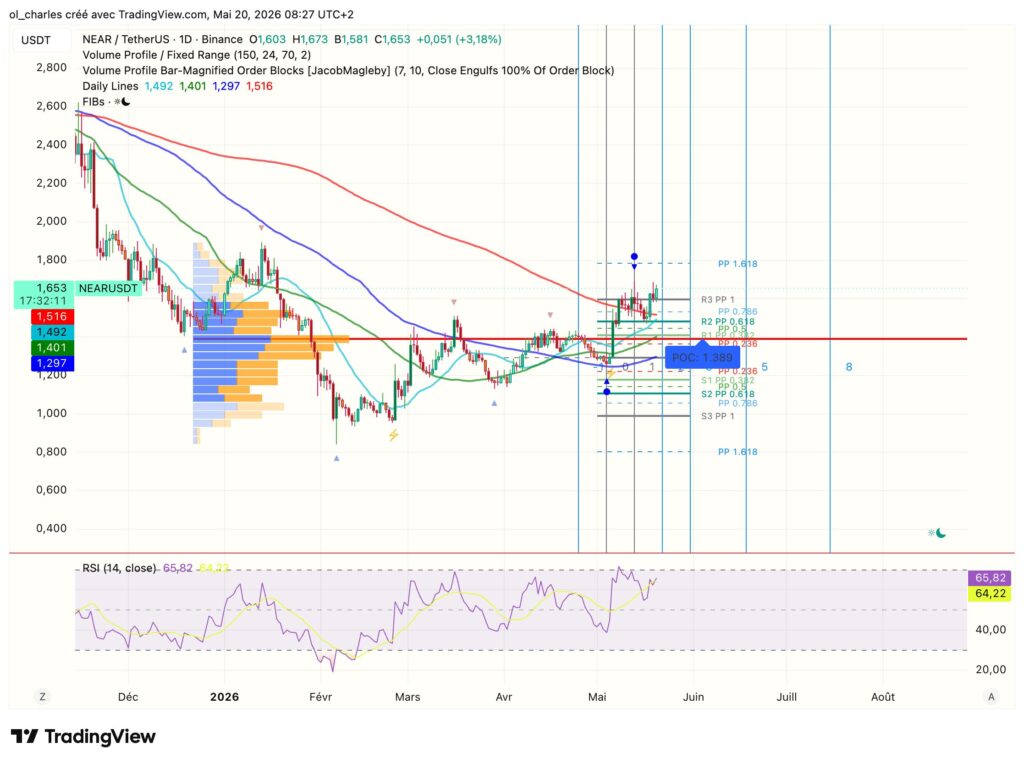
The Fibonacci retracement indicates an immediate first resistance at $1.77. This zone up to $1.90 will be crucial for what comes next. A rejection at this level and NEAR will return to the first key support at $1.54. If the latter breaks, the longs down to $1.37 will highly likely be swept.
It is worth noting that NEAR is trading above its 200-day moving average at $1.51. This is therefore a key MA to watch as a bullish crossover with the 50-day MA is brewing.
Conversely, a bearish scenario can never be ruled out in the crypto ecosystem. Sudden profit-taking by whales could trigger a technical correction. Furthermore, a bearish divergence on the RSI is visible on higher timeframes (HTF). In this case, a retracement toward lower support zones would be necessary to flush out the market before a potential resumption of the uptrend.
With such solid fundamentals and booming on-chain activity, the question is no longer whether the project is attracting capital, but whether it can retain it. Will buyers maintain control in the face of impending volatility, or will we witness a surprise market reversal?
Sources:
Related Articles:

Charles Ledoux is a Bitcoin and blockchain technology specialist. A graduate of the Crypto Academy, he has been a Bitcoin miner for over a year. He has written numerous masterclasses to educate newcomers to the industry and has authored over 2,000 articles on cryptocurrency. Now, he aims to share his passion for crypto through his articles for InvestX.
DISCLAIMER
This article is for informational purposes only and should not be considered as investment advice. Trading cryptocurrencies involves risks, and it is important not to invest more than you can afford to lose.
InvestX is not responsible for the quality of the products or services presented on this page and cannot be held liable, directly or indirectly, for any damage or loss caused by the use of any product or service featured in this article. Investments in crypto assets are inherently risky; readers should conduct their own research before taking any action and invest only within their financial means. This article does not constitute investment advice.


Risk Warning : Trading financial instruments and/or cryptocurrencies carries a high level of risk, including the possibility of losing all or part of your investment. It may not be suitable for all investors. Cryptocurrency prices are highly volatile and can be influenced by external factors such as financial, regulatory, or political events. Margin trading increases financial risks.
CFDs (Contracts for Difference) are complex instruments with a high risk of rapid capital loss due to leverage. Between 74% and 89% of retail investor accounts lose money when trading CFDs. You should assess whether you understand how CFDs work and whether you can afford to take the high risk of losing your money.
Before engaging in financial or cryptocurrency trading, you must be fully informed about the associated risks and fees, carefully evaluate your investment objectives, level of experience, and risk tolerance, and seek professional advice if needed. InvestX.fr and the InvestX application may provide general market commentary, which does not constitute investment advice and should not be interpreted as such. Please consult an independent financial advisor for any investment-related questions. InvestX.fr disclaims any liability for errors, misinvestments, inaccuracies, or omissions and does not guarantee the accuracy or completeness of the information, texts, graphics, links, or other materials provided.
Some of the partners featured on this site may not be regulated in your country. It is your responsibility to verify the compliance of these services with local regulations before using them.
