

Solana (SOL) collapses: Will the $80 support break?
Decentralized exchange volumes on Solana have just hit their lowest level since 2024, putting massive pressure on the token. Currently trading between $81 and $83, SOL is experiencing a sharp retracement following a violent rejection around $93 last week, representing a correction of nearly 11%.
The main driver behind this drop is a drastic decline in activity across its platforms. According to DefiLlama data, DEX volumes on Solana have plunged to $55.5 billion, a level unseen since September 2024. Network fees have also melted away, dropping from $30 million in January to just $18.5 million in March, marking a 42% decrease. This contraction is fueling short term bearish sentiment. This is especially true as Ethereum layer 2 networks are rapidly gaining market share.
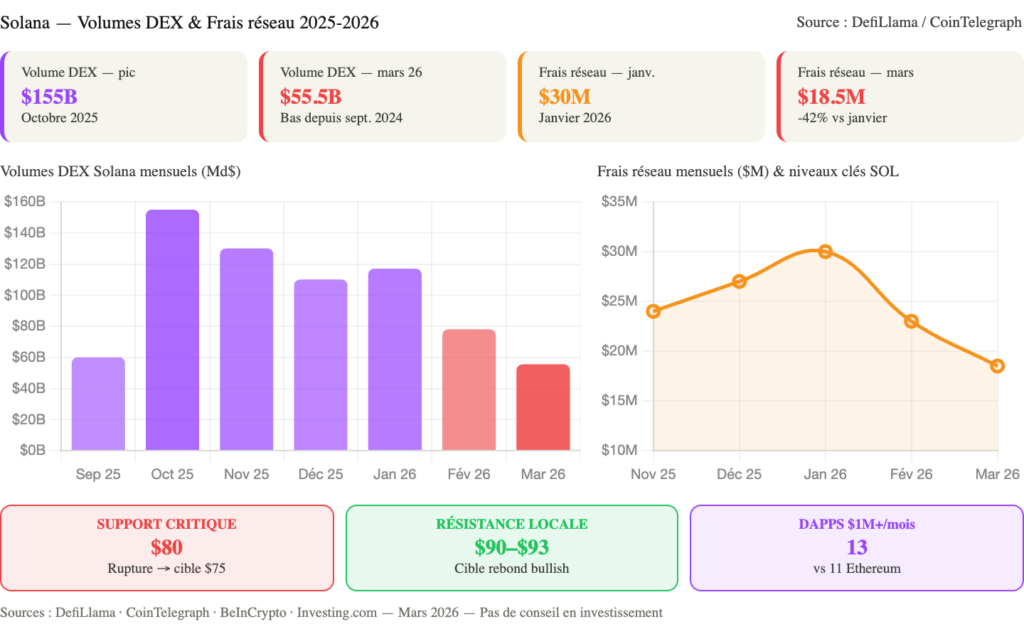
Is the key $80 support at risk?
On the technical front, the 14 day RSI for Solana stands at 46.3, sitting in neutral territory. Moving averages are flashing a dominant sell signal. There are 8 sell signals compared to only 4 buy signals across the MA5 to MA200. The MACD shows clear signs of exhaustion, confirming the temporary dominance of sellers.
The $80 level has absorbed the majority of the selling pressure during this pullback and has been tested multiple times. This makes it the most significant short term support. In the event of a breakdown, the measured move from the head and shoulders pattern identified on the 3 day chart points toward a technical target around $59.
However, despite this bearish momentum, the Solana ecosystem maintains strong fundamentals. The network boasts 13 DApps generating over one million dollars in monthly revenue over the past 30 days, compared to 11 for Ethereum, 4 for BNB Chain and 4 for Base. This fundamental resilience could slow down the decline.
Two scenarios are emerging. From a bullish perspective, if buyers defend the $80 support, forecasting models indicate a 4 to 7% upside. This would bring SOL back between $89 and $92 by the end of March 2026. There is also a possible extension toward $95 if market sentiment recovers.
In the bearish scenario, losing the $80 mark would trigger the measured move of the head and shoulders pattern, placing the technical target around $59 to $64. This level would represent the definitive breakdown of the bullish structure built since the last bull run.
The market reaction to this critical support will dictate the medium term trend. Investors will need to closely monitor DEX volumes on DefiLlama and the evolution of network fees to confirm the direction of the next move.
Sources:
Related Articles:

