

The Technical Battle: Order Blocks and Friction Zones
Solana ‘s current market structure reveals a typical compression before a major expansion. In the short term, price action is literally trapped under a glass ceiling. The analysis highlights a 1-hour timeframe Order Block extending up to $127.75. This initial barrier is reinforced by an even denser resistance zone on the 30-minute chart, located between $127 and $129.5.
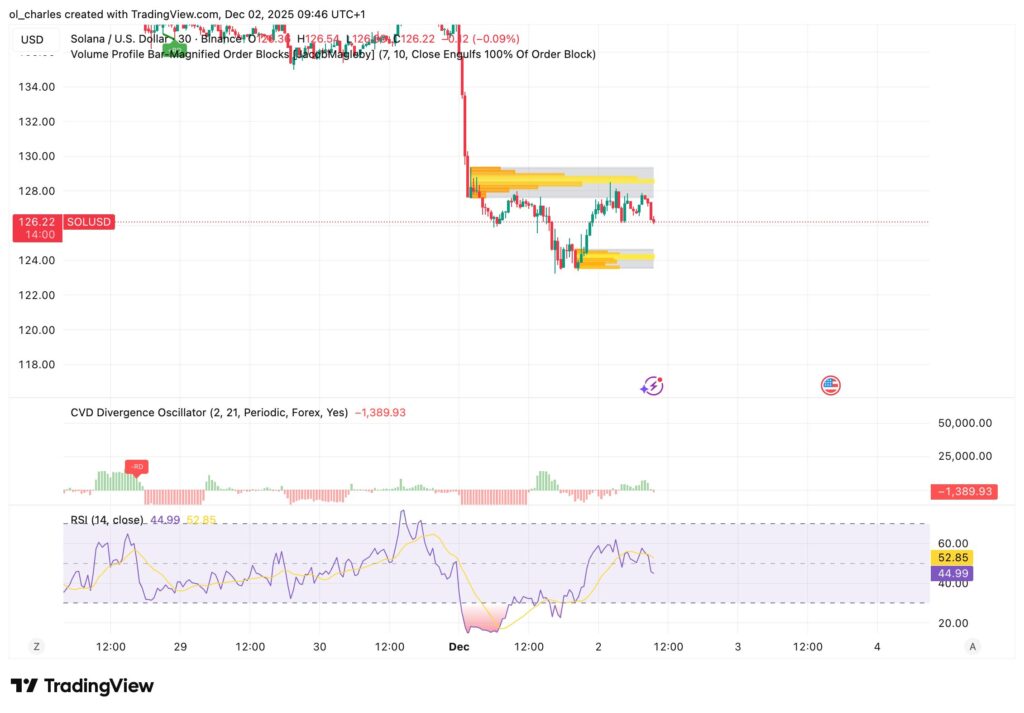
These levels act as a distribution zone where sellers regain control. As long as SOL fails to break free from this zone with volume, short-term bearish pressure remains dominant. Conversely, in case of rejection, buyers will need to defend the major support identified between $109 and $115. This is where the weekly trend hangs in the balance: losing this level would open the door to a deeper correction.
Solana Analysis SOL ETF: The Institutional Flow Anomaly
The most intriguing aspect of this week lies in institutional investor behavior. Observing recent flows, we notice a glaring anomaly at the heart of SOL ETFs. During November 2025, Solana ETFs recorded capital inflows almost every day, with the exception of a single session.
Yet this bullish signal is contradicted by a negative funding rate for almost the entire period. This divergence suggests a complex strategy by large wallets: they are massively buying the spot ETF while shorting the token or perpetual contracts to hedge their position or capture the differential. This type of maneuver, reminiscent of certain volatility strategies, artificially keeps the price under pressure despite real demand.
DeFi and Liquidity Clusters: The Powder Keg Is Ready
On the fundamental side, the ecosystem shows no weakness. TVL (Total Value Locked) reaches $8.8 billion, and volume on DEXs (decentralized exchanges) exceeded $18.8 billion over 7 days. Even more impressive, Solana now captures over 95% of the global tokenized equity market. These figures confirm that network usage is at its peak, decoupled from price hesitation.
However, the market is drawn to liquidity. The liquidation heatmap shows two critical zones:
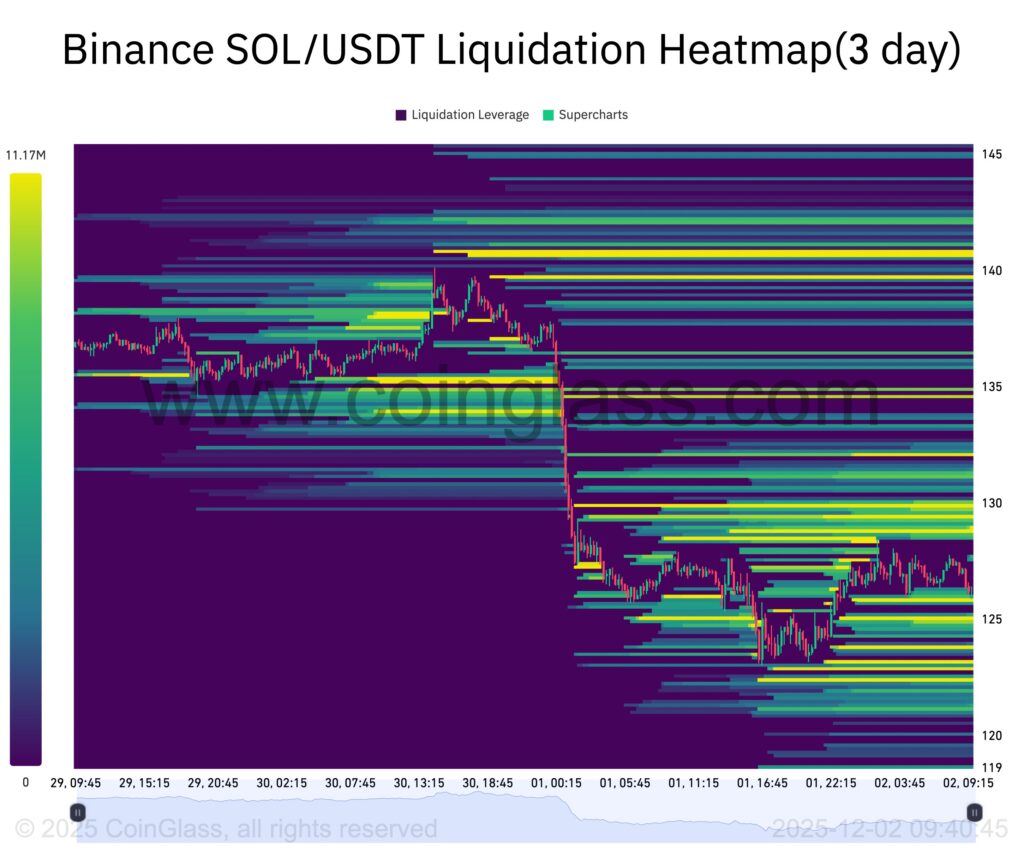
- A $10 million short cluster positioned at $129.9. If price breaks through the resistances mentioned above, these positions will be forced to buy back, propelling the price higher.
- A massive $20 million long cluster at $121.8. This is the closest and most lucrative target for market makers.
Weekly Scenarios: Bounce or Purge?
The current configuration suggests a liquidity hunt before choosing a clear direction. The most likely short-term scenario involves a visit to $121.8 to flush out overextended long positions. If the $109 to $115 support gives way to selling pressure, price will find its ideal demand zone (3-day Order Block) between $98 and $109, offering an optimal technical entry point for a rebound.
Conversely, if buyers manage to absorb the supply and trigger a short squeeze above $129.9, the path would be clear for a more pronounced bullish recovery, finally aligning price with Solana’s explosive DeFi fundamentals.
Related articles:

