Why Did Solana (SOL) Drop 11% in Just a Few Hours ?
Solana plunges below key levels as bears strengthen their grip.
Technical indicators show worrisome bearish signals for SOL.
A retest of February lows appears imminent if momentum does not swiftly reverse.
Solana (SOL) Plunges 10% as Bears Take Control : What Lies Ahead ?
The Solana (SOL) token is currently grappling with intense selling pressure, with its price dropping over 10% in the last 24 hours. As key technical indicators like the Ichimoku Cloud and BBTrend confirm sellers’ control, the risk of a continued downtrend appears to be strengthening.
With SOL now trading well below crucial levels, attention turns to the critical support at $112. A decisive break below this threshold could trigger a new cycle of massive selling, with SOL threatening to retest its yearly lows reached in February 2024.
Bearish Signals Intensify for Solana
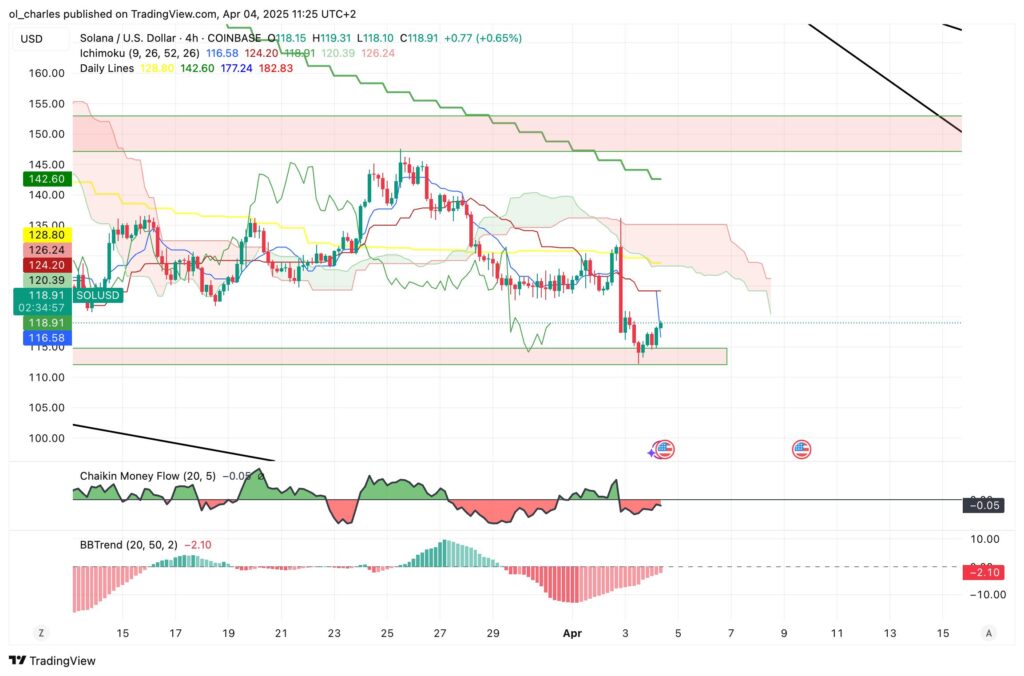
Solana’s 4-hour chart with the Ichimoku cloud currently displays concerning bearish signals. The price has clearly broken below the Tenkan-sen (blue line) and Kijun-sen (red line), confirming a clear rejection of short-term support levels.
Both lines are now pointing downward, reinforcing the prospect of strengthening bearish momentum. The significant gap between the latest candles and the cloud further suggests that any rebound attempt would face substantial resistance.
$SOL is sitting at a critical support zone $100–110.
However, the Kijun has bounced off strong support, indicating that SOL could potentially rebound in the short term. According to RGT Wagmi and Nihilus, SOL might target the zone between $147 and $153 in the coming days, likely during the weekend.
Nevertheless, the red cloud projected forward is thick and sloping downward, indicating that selling pressure should persist in the upcoming sessions. With the price well below the cloud, typically characterizing a strong bearish trend, Solana appears to face major challenges in reversing its current trajectory in the medium term.
Meanwhile, Solana’s BBTrend indicator remains deeply entrenched in negative territory at -6, demonstrating strong persistence of bearish momentum and low probabilities of a short-term reversal. With values generally considered significant beyond 5, this sustained bearish signal adds additional weight to the accumulating technical warnings for SOL.
A Drop Below $50 in the Coming Months ?
From a price analysis perspective, Solana is dangerously approaching the key support level of $112 after breaking below the $115 mark. A confirmed breach below this level could pave the way for a new phase of substantial losses.
In such a bearish scenario, SOL’s price risks plunging back toward the annual lows reached in February 2024 around $110, or even targeting lower levels. The current momentum and strong bearish signals observed on technical indicators pose a high risk of a new selling cycle.
However, if Solana manages to stabilize and reverse its trajectory, a first potential resistance level around $120 could be targeted. Breaking this threshold would provide the first sign of recovery, and if bullish momentum accelerates, higher targets at $131 and $136 could then come into focus, before confronting the strong zone at $147.
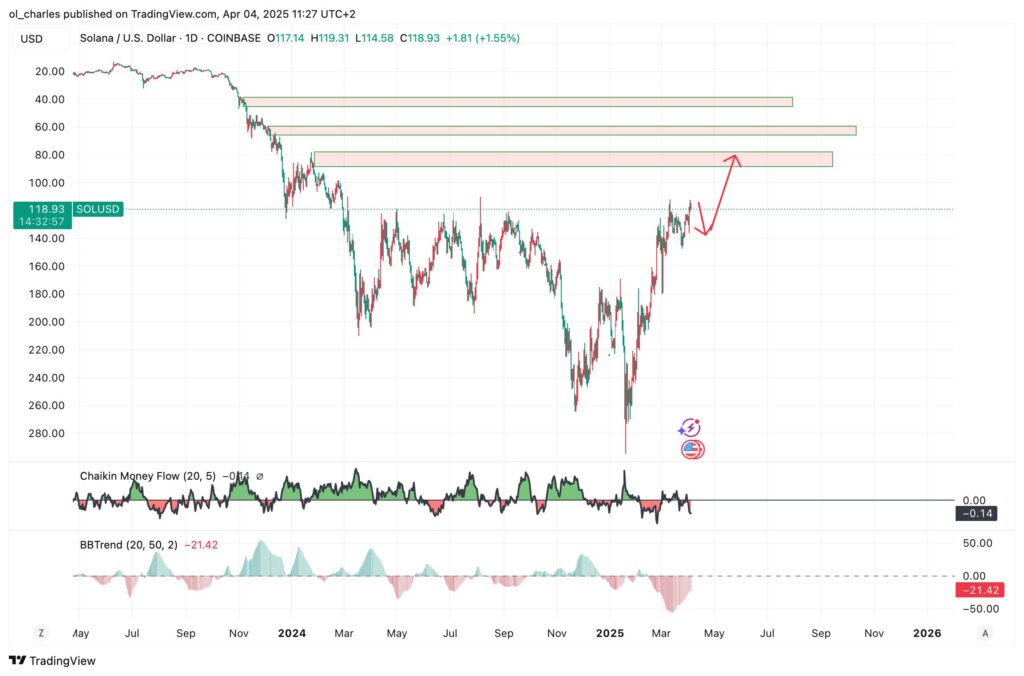
For the coming months, Solana appears to be heading toward a double-digit price. Many experts agree that SOL could even fall to as low as $50. Analyst Sri highlights a Wyckoff distribution pattern on SOL’s price chart, indicating a potential downward phase ahead.
Indeed, by inverting the daily price chart, it becomes easier to understand the trend. It’s evident that SOL will likely target $80 in the coming weeks. Subsequently, if bearish market conditions persist, it could drop to the $50-75 or $45 zones afterward.
In conclusion, Solana is facing significant headwinds at the moment. Despite potential for a technical rebound in the short term, analysts seem to agree on the need for a major change in dynamics to dispel the specter of an imminent retest of recent lows. In a persistently bearish context, patience and prudent risk management will be essential for investors exposed to the SOL token.
In case of a drop to $80, SOL has a high chance of a short-term rebound. Here’s a practical guide to easily purchase SOL, all while being able to set buy orders at specified prices :
Create a Weex account : Go to Weex’s official website and sign up using your email or phone number.
Verify your identity (KYC) : Complete the KYC verification by submitting an ID document and, if required, proof of address. This quick step is necessary to use the platform.
Add funds : In “Deposit,” fund your wallet with crypto (USDT, BTC, etc.) or via fiat (bank card, bank transfer, depending on availability). Follow the steps to finalize the deposit.
Access the market to buy SOL : Go to “Spot Trading,” search for “SOL” in the dedicated bar, and select the SOL/USDT pair to open the exchange interface.
Make the purchase : Choose a market order for instant purchase or a limit order to set a specific price. Indicate the desired quantity of SOL, verify, then confirm.
Charles Ledoux is a Bitcoin and blockchain technology specialist. A graduate of the Crypto Academy, he has been a Bitcoin miner for over a year. He has written numerous masterclasses to educate newcomers to the industry and has authored over 2,000 articles on cryptocurrency. Now, he aims to share his passion for crypto through his articles for InvestX.
DISCLAIMER
This article is for informational purposes only and should not be considered as investment advice. Some of the partners featured on this site may not be regulated in your country. It is your responsibility to verify the compliance of these services with local regulations before using them.
DISCLAIMER
This article is for informational purposes only and should not be considered as investment advice. Trading cryptocurrencies involves risks, and it is important not to invest more than you can afford to lose.
InvestX is not responsible for the quality of the products or services presented on this page and cannot be held liable, directly or indirectly, for any damage or loss caused by the use of any product or service featured in this article. Investments in crypto assets are inherently risky; readers should conduct their own research before taking any action and invest only within their financial means. This article does not constitute investment advice.
Risk Warning : Trading financial instruments and/or cryptocurrencies carries a high level of risk, including the possibility of losing all or part of your investment. It may not be suitable for all investors. Cryptocurrency prices are highly volatile and can be influenced by external factors such as financial, regulatory, or political events. Margin trading increases financial risks.
CFDs (Contracts for Difference) are complex instruments with a high risk of rapid capital loss due to leverage. Between 74% and 89% of retail investor accounts lose money when trading CFDs. You should assess whether you understand how CFDs work and whether you can afford to take the high risk of losing your money.
Before engaging in financial or cryptocurrency trading, you must be fully informed about the associated risks and fees, carefully evaluate your investment objectives, level of experience, and risk tolerance, and seek professional advice if needed. InvestX.fr and the InvestX application may provide general market commentary, which does not constitute investment advice and should not be interpreted as such. Please consult an independent financial advisor for any investment-related questions. InvestX.fr disclaims any liability for errors, misinvestments, inaccuracies, or omissions and does not guarantee the accuracy or completeness of the information, texts, graphics, links, or other materials provided.
Some of the partners featured on this site may not be regulated in your country. It is your responsibility to verify the compliance of these services with local regulations before using them.
Get 6200 USDT with Bitget ! 🔥
Don't miss out on this offer !
Create your account now to unlock this exclusive reward