

Bullish Movement Linked to Selling Pressure
When the price of an asset moves in a descending channel, characterized by a series of lower highs and lower lows, it is referred to as a “wedge” or bearish “coin” pattern. This technical setup generally reflects a loss of bearish momentum, often signaling a trend reversal.
This is precisely what happened with Solana in recent weeks. After hitting an all-time high at $295.83 on January 19, the price of SOL formed a bearish wedge, under selling pressure. However, on March 19, the asset finally managed to break above the upper limit of this pattern, indicating a possible bullish trend reversal.
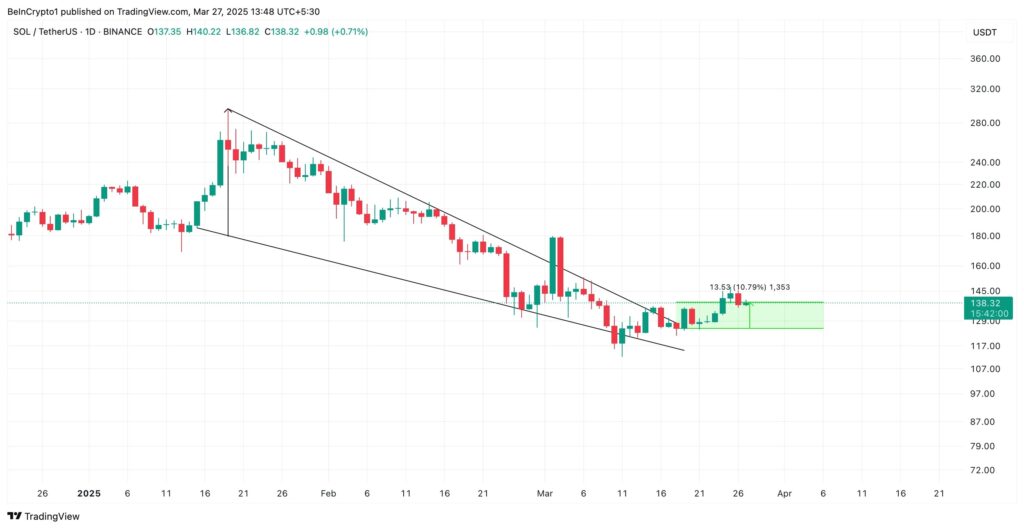
When an asset manages to break above a bearish wedge, it indicates that selling pressure has weakened and buyers regain control. In the case of SOL, this momentum was accompanied by a significant increase in open interest, reaching $4.81 billion at the time of writing, representing a 22% rise since the breakout.
Promising Bullish Outlook for Solana
This technical setup, combined with the strength of the rebound in open interest, suggests a continuation of the bullish momentum for Solana. Therefore, when an asset breaks out of a bearish wedge, its price is likely to appreciate by an amount equivalent to the maximum height of the pattern. Applied to Solana, this could result in an increase of 67%, pushing the price of SOL up to $230.
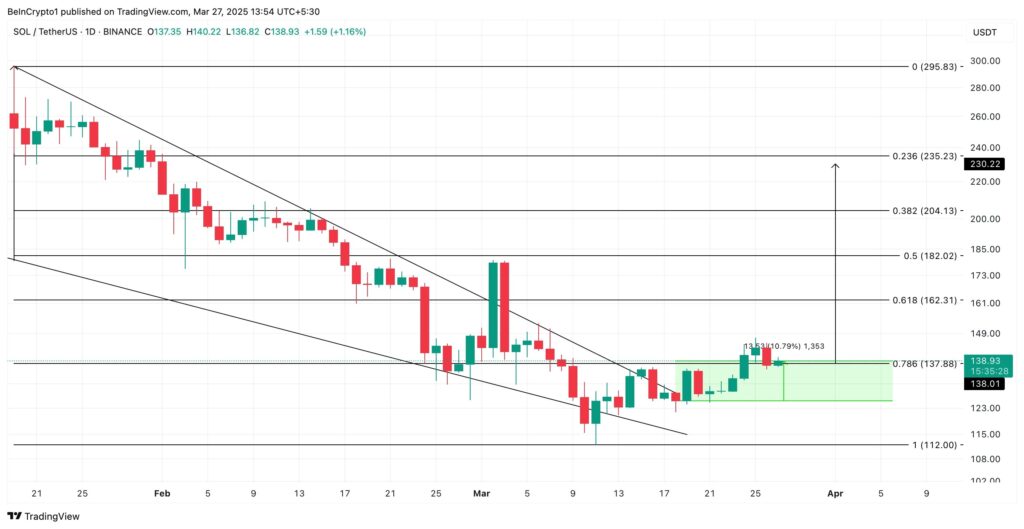
However, this scenario is subject to several uncertainties. If selling pressure intensifies again, Solana could fall back towards $112. Investors must remain vigilant regarding market dynamics in the weeks ahead.
In conclusion, the recent bullish breakout of SOL, along with the strength of its open interest and the robustness of its Aroon Up, suggests a continued positive trend for Solana. Yet, there are risks of a reversal, emphasizing the importance of a thorough analysis of technical indicators before engaging with this cryptocurrency.

