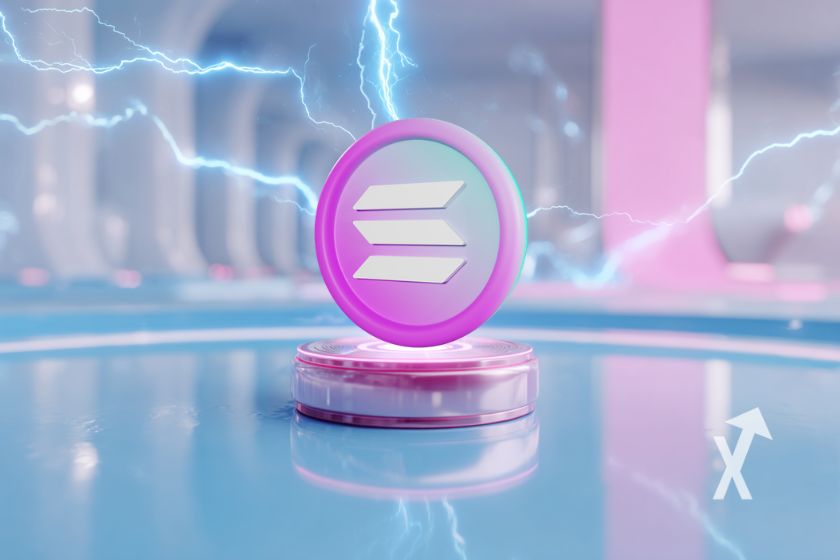
Solana: Whales Bet $15 Million Short — Can SOL Crash to $40?
Whales have opened $15M in short positions on Solana. Can SOL break down to $40? Here's what the on-chain data and key levels are saying.


Whales have opened $15M in short positions on Solana. Can SOL break down to $40? Here's what the on-chain data and key levels are saying.
Major market players have just opened $15 million worth of short positions on Solana. A signal that is hard to ignore as SOL stagnates in a tense consolidation zone around the $70 mark.
Beneath this apparent calm lies a fierce battle between bulls and bears that could determine the asset’s next major move. On-chain data and technical levels tell a far more complex story than simple price action alone.
How far can the bears push SOL? And what conditions need to align for a drop to $40 to become a realistic scenario?
According to data from CoinGlass, several wallets identified as whales have opened massive short positions on SOL, accumulating close to $15 million in bearish exposure. This kind of large-scale, coordinated bet is rarely insignificant — it reflects a strong conviction that the current price represents a major resistance point.
The $70 zone is currently acting as a glass ceiling. For several weeks now, SOL has repeatedly failed to establish itself above this level. Every breakout attempt has been met with renewed selling pressure, fueled in part by these institutional short positions. Trading volume remains thin during relief rallies, which weakens the short-term bullish case considerably.
On CryptoQuant, the Long/Short ratio is gradually tilting in favor of shorts across major derivatives platforms. The funding rate, while only slightly negative, confirms that the prevailing sentiment is cautious, if not outright bearish. In this context, a prolonged consolidation below $70 mechanically increases the risk of a downside breakdown.

A collapse to $40 would represent a correction of roughly 43% from current levels. This extreme scenario is not impossible, but it requires a precise combination of technical and macroeconomic conditions to materialize.
On the weekly chart, key support levels sit at $58 and then $47–$48, two zones that served as a floor during the corrections of 2024. Should SOL break below the $58 support on significant volume, the path toward $40 would open up technically. This level corresponds to a 61.8% Fibonacci retracement from the cycle low — a zone that has historically acted as a magnet during prolonged bear markets.
The catalyst for such a drop would most likely be exogenous: a sharp reversal in Bitcoin below $75,000, a cascade of liquidations across derivatives markets, or a sudden macro deterioration such as a Fed decision or a liquidity crisis. Without that kind of external shock, the bears will struggle to sustain enough pressure to break through successive intermediate support levels.
For the bullish camp to regain control, SOL absolutely needs to hold the $65 support and reclaim $75 on a weekly close. This level represents not only a major technical resistance but also the psychological threshold above which short liquidations could trigger a violent short squeeze.
Solana‘s fundamentals remain solid: the network is posting DEX transaction volumes among the highest in the entire ecosystem, surpassing Ethereum on certain sessions. TVL (Total Value Locked) is holding above $4 billion according to DefiLlama, and developer activity remains robust. These factors provide a fundamental safety net that mechanically limits the long-term downside potential.
The real question, then, is not whether SOL can fall to $40 — technically it can, under the right conditions — but whether the market will give it the opportunity to do so. Every session that closes above $68–$70 reduces that probability and gradually strengthens the case for an accumulation phase ahead of the next bullish move.

Thomas holds a BTS in computer science with a specialization in SEO and is certified in web writing and e-commerce. Passionate about blockchain technology and cryptocurrencies since 2018, he specializes in analyzing crypto market cycles. His journey into GPU mining began in 2019 with ETH before transitioning to KASPA and Alephium (ALPH).
DISCLAIMER
This article is for informational purposes only and should not be considered as investment advice. Trading cryptocurrencies involves risks, and it is important not to invest more than you can afford to lose.
InvestX is not responsible for the quality of the products or services presented on this page and cannot be held liable, directly or indirectly, for any damage or loss caused by the use of any product or service featured in this article. Investments in crypto assets are inherently risky; readers should conduct their own research before taking any action and invest only within their financial means. This article does not constitute investment advice.

Risk Warning : Trading financial instruments and/or cryptocurrencies carries a high level of risk, including the possibility of losing all or part of your investment. It may not be suitable for all investors. Cryptocurrency prices are highly volatile and can be influenced by external factors such as financial, regulatory, or political events. Margin trading increases financial risks.
CFDs (Contracts for Difference) are complex instruments with a high risk of rapid capital loss due to leverage. Between 74% and 89% of retail investor accounts lose money when trading CFDs. You should assess whether you understand how CFDs work and whether you can afford to take the high risk of losing your money.
Before engaging in financial or cryptocurrency trading, you must be fully informed about the associated risks and fees, carefully evaluate your investment objectives, level of experience, and risk tolerance, and seek professional advice if needed. InvestX.fr and the InvestX application may provide general market commentary, which does not constitute investment advice and should not be interpreted as such. Please consult an independent financial advisor for any investment-related questions. InvestX.fr disclaims any liability for errors, misinvestments, inaccuracies, or omissions and does not guarantee the accuracy or completeness of the information, texts, graphics, links, or other materials provided.
Some of the partners featured on this site may not be regulated in your country. It is your responsibility to verify the compliance of these services with local regulations before using them.
