TRX at $0.28: Will Tron’s Crash Continue This Week?
Tron's price sees a disappointing 3.65% drop this week, hovering around $0.2881. On-chain signals show a notable decrease in network activity, with 4.11 million active addresses, while technical analysis suggests further downward pressure.
Tron’s On-Chain Activity Shows Signs of Exhaustion
Data reveals a concerning decline in the number of active addresses on the Tron (TRX) network. The drop below 4.11 million active addresses marks a notable decrease from recent highs, suggesting a gradual disengagement of participants. This network activity contraction directly corresponds to the price decline from $0.296 to $0.287.
This phenomenon betrays a lack of user enthusiasm, possibly linked to widespread wait-and-see attitudes in the face of macroeconomic volatility in the crypto market. Historically, when Tron’s on-chain activity decreases, the price generally follows the same trajectory. Active addresses constitute a reliable leading indicator, more revealing than simple trading volume which can be artificially inflated.
If this downward trend in active addresses continues in the coming days, TRX risks testing even lower support levels. Investors are closely monitoring this metric, knowing that a recovery in network activity could quickly reverse the current dynamic. For now, on-chain signals argue for increased caution.
Technical Analysis: TRX Trapped Between Key Supports and Resistances
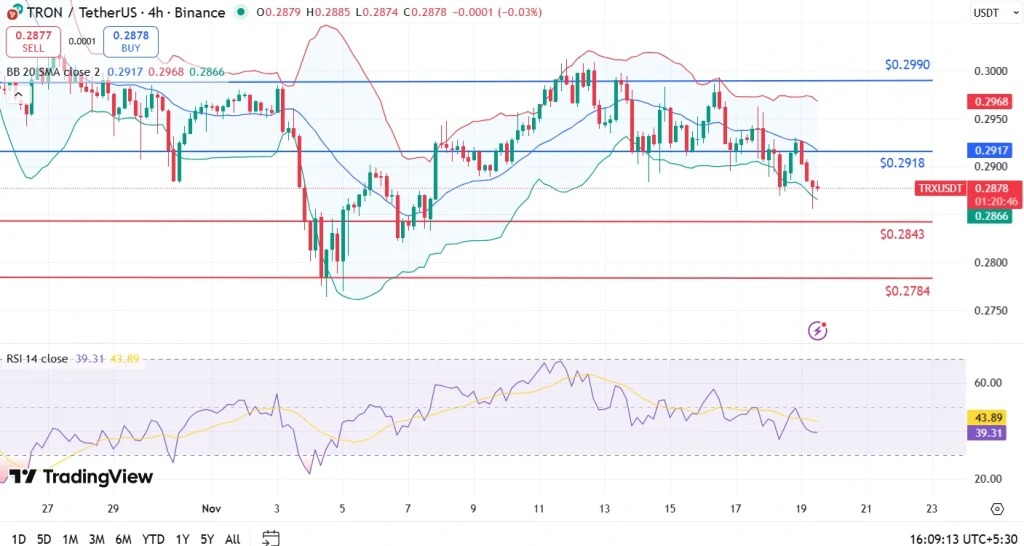
TRX’s price chart is currently drawing a delicate technical configuration. The token is trading just below the major resistance at $0.2918, while defending immediate support at $0.2843. Bollinger Bands indicate volatility compression, a typical signal of an imminent directional movement one way or another.
Source: TradingView
Momentum indicators reinforce the bearish bias. The RSI at 39.31 approaches the oversold zone without reaching it yet, while the second oscillator at 43.89 confirms the absence of significant buying pressure. This configuration suggests that sellers still control the short-term dynamic, even though the potential for a technical bounce exists from these levels.
A downward break below support at $0.2843 would open the path toward $0.2784, a critical level that could be tested by the end of the week. Conversely, a recovery above $0.2918 would completely change the situation and allow for envisioning a return toward $0.2990. Volumes will nevertheless need to accompany any bullish movement for it to be credible.
Gaston has been a writer for over 7 years and a passionate cryptocurrency enthusiast since 2020. He loves exploring the crypto ecosystem and is now dedicated to sharing his insights and discoveries through InvestX.
DISCLAIMER
This article is for informational purposes only and should not be considered as investment advice. Some of the partners featured on this site may not be regulated in your country. It is your responsibility to verify the compliance of these services with local regulations before using them.
DISCLAIMER
This article is for informational purposes only and should not be considered as investment advice. Trading cryptocurrencies involves risks, and it is important not to invest more than you can afford to lose.
InvestX is not responsible for the quality of the products or services presented on this page and cannot be held liable, directly or indirectly, for any damage or loss caused by the use of any product or service featured in this article. Investments in crypto assets are inherently risky; readers should conduct their own research before taking any action and invest only within their financial means. This article does not constitute investment advice.
Risk Warning : Trading financial instruments and/or cryptocurrencies carries a high level of risk, including the possibility of losing all or part of your investment. It may not be suitable for all investors. Cryptocurrency prices are highly volatile and can be influenced by external factors such as financial, regulatory, or political events. Margin trading increases financial risks.
CFDs (Contracts for Difference) are complex instruments with a high risk of rapid capital loss due to leverage. Between 74% and 89% of retail investor accounts lose money when trading CFDs. You should assess whether you understand how CFDs work and whether you can afford to take the high risk of losing your money.
Before engaging in financial or cryptocurrency trading, you must be fully informed about the associated risks and fees, carefully evaluate your investment objectives, level of experience, and risk tolerance, and seek professional advice if needed. InvestX.fr and the InvestX application may provide general market commentary, which does not constitute investment advice and should not be interpreted as such. Please consult an independent financial advisor for any investment-related questions. InvestX.fr disclaims any liability for errors, misinvestments, inaccuracies, or omissions and does not guarantee the accuracy or completeness of the information, texts, graphics, links, or other materials provided.
Some of the partners featured on this site may not be regulated in your country. It is your responsibility to verify the compliance of these services with local regulations before using them.
Get 6200 USDT with Bitget ! 🔥
Don't miss out on this offer !
Create your account now to unlock this exclusive reward