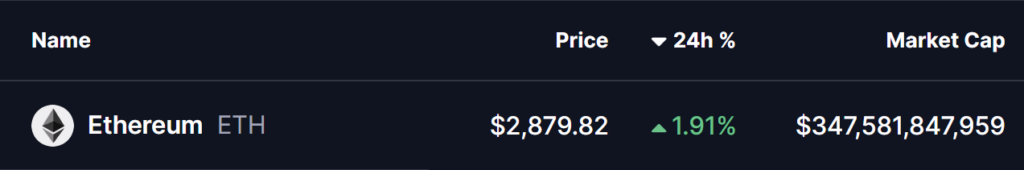
Why Ethereum (ETH) is set to skyrocket this week ?
Ethereum is entering a crucial zone as various indicators - institutional inflows, on-chain activity, and technical structure - signal an impending massive move. With market uncertainty, ETH shows remarkable resilience, bolstered by increased interest from whales and buying signals. This week could be decisive: will we see a strong rebound or a bullish acceleration towards a new key area?
Translated on November 24, 2025 at 13:59 by Simon Dumoulin
Copié
A Bearish ABC Harmonic Pattern Is Forming on the Weekly Chart
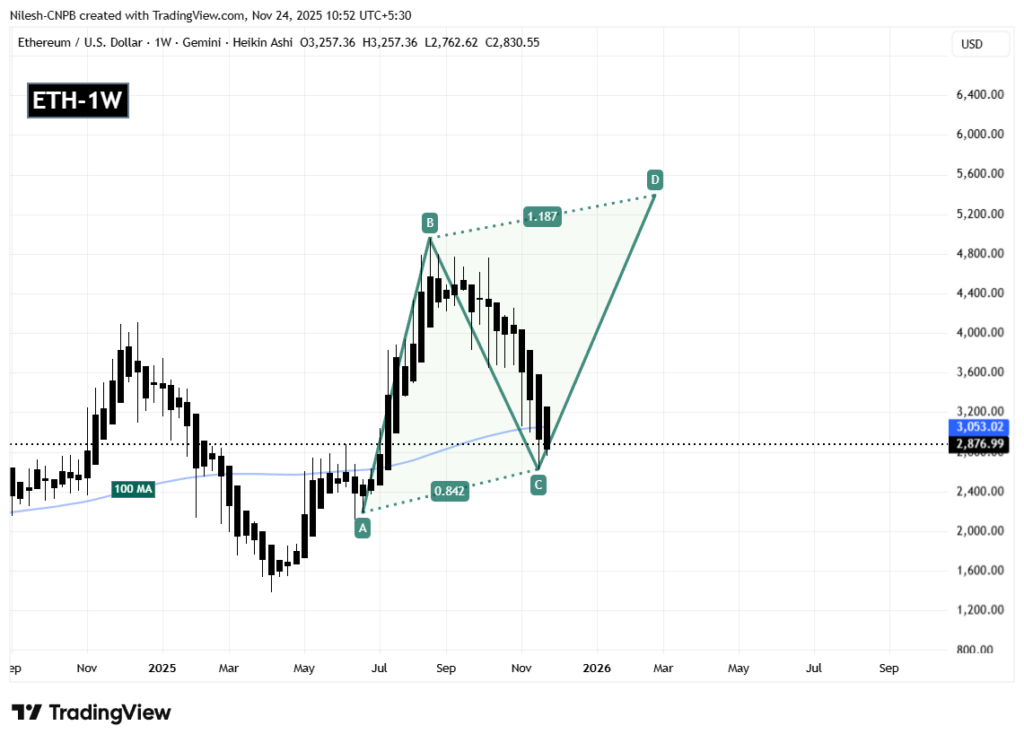
The weekly chart of Ethereum currently reveals a particularly interesting technical configuration: a potential bearish ABC harmonic pattern. This classic technical analysis structure typically identifies reversal zones favorable to a significant bullish move during the formation of the CD leg.
The construction of this pattern began at Point A, positioned near $2,188.98. ETH then initiated a vigorous bullish impulse up to Point B, before triggering a sharp correction that brought it down to Point C at $2,624.88. This low level now constitutes a critical support for the validity of the setup. The bullish reaction observed from this floor, with a rapid bounce above $2,875, reinforces the hypothesis of a CD leg currently forming.
The key technical element remains the 100-week moving average, currently positioned at $3,053. A confirmed weekly close above this MA would constitute a powerful technical signal to validate the return of a structural bullish dynamic. The buying volumes observed during the bounce from $2,624 suggest that institutional buyers are actively defending this zone.
Target at $5,391: Realistic or Too Optimistic for Ethereum?
If the harmonic scenario fully materializes, the Potential Reversal Zone (PRZ) calculated via the Fibonacci extension 1.187 places the final target of the pattern near $5,391.87. This represents an upside potential of approximately 86% from current levels, a move perfectly consistent with the characteristics of harmonic patterns on long timeframes.
For this scenario to unfold, several technical conditions must be met. First, the support at $2,624.88 must absolutely not be broken on a weekly close. Second, ETH must maintain its price above the 100-week MA and ideally transform this level into support. Volumes must also accompany the progression to confirm the strength of the move.
Experienced traders are also monitoring intermediate levels, particularly the psychological resistance of $3,500 and the former consolidation zone around $4,000. These areas could generate temporary profit-taking before continuation toward the final target. Caution remains warranted: a violent rejection below $2,624 would completely invalidate this harmonic structure and open the door to a deeper correction, potentially toward $2,200.
Do Fundamental Factors Support This Technical Scenario?
Beyond chart analysis, several fundamental elements could catalyze this Ethereum rebound. The approach of the network’s next upgrade and the constant increase in institutional staking reinforce the medium-term bullish narrative. Inflows into spot Ethereum ETFs in the United States also show signs of progressive accumulation.
The macroeconomic context also plays a crucial role. Ethereum’s current correlation with U.S. equity indices and Bitcoin strongly influences its short-term volatility. Stabilization of traditional markets could unlock the bullish potential identified by the harmonic pattern. Professional traders are already positioning their stops below Point C to limit risk while targeting the PRZ.
The timeframe for this structure typically extends over several weeks. The upcoming weekly closes will be decisive to confirm or invalidate this scenario. Momentum indicators like the weekly RSI currently show a bullish divergence, reinforcing the hypothesis of an imminent technical rebound.
Passionate about the crypto world, he explores the blockchain ecosystem to extract the most essential insights. With his expertise in SEO and web writing, he transforms news and technical analysis into clear, engaging, and impactful content. His goal? To help investors better understand the opportunities and challenges of the crypto market.
DISCLAIMER
This article is for informational purposes only and should not be considered as investment advice. Some of the partners featured on this site may not be regulated in your country. It is your responsibility to verify the compliance of these services with local regulations before using them.
DISCLAIMER
This article is for informational purposes only and should not be considered as investment advice. Trading cryptocurrencies involves risks, and it is important not to invest more than you can afford to lose.
InvestX is not responsible for the quality of the products or services presented on this page and cannot be held liable, directly or indirectly, for any damage or loss caused by the use of any product or service featured in this article. Investments in crypto assets are inherently risky; readers should conduct their own research before taking any action and invest only within their financial means. This article does not constitute investment advice.
Risk Warning : Trading financial instruments and/or cryptocurrencies carries a high level of risk, including the possibility of losing all or part of your investment. It may not be suitable for all investors. Cryptocurrency prices are highly volatile and can be influenced by external factors such as financial, regulatory, or political events. Margin trading increases financial risks.
CFDs (Contracts for Difference) are complex instruments with a high risk of rapid capital loss due to leverage. Between 74% and 89% of retail investor accounts lose money when trading CFDs. You should assess whether you understand how CFDs work and whether you can afford to take the high risk of losing your money.
Before engaging in financial or cryptocurrency trading, you must be fully informed about the associated risks and fees, carefully evaluate your investment objectives, level of experience, and risk tolerance, and seek professional advice if needed. InvestX.fr and the InvestX application may provide general market commentary, which does not constitute investment advice and should not be interpreted as such. Please consult an independent financial advisor for any investment-related questions. InvestX.fr disclaims any liability for errors, misinvestments, inaccuracies, or omissions and does not guarantee the accuracy or completeness of the information, texts, graphics, links, or other materials provided.
Some of the partners featured on this site may not be regulated in your country. It is your responsibility to verify the compliance of these services with local regulations before using them.
Get 6200 USDT with Bitget ! 🔥
Don't miss out on this offer !
Create your account now to unlock this exclusive reward