XRP and XLM Prices Dip: Is a Deeper Correction on the Horizon?
Altcoin market turbulence persists: XRP struggles to break $3, while XLM drops below key moving averages. Liquidations rise as BTC reigns, driving traders to safer assets. How far can these cryptos drop, and what signals to watch for next?
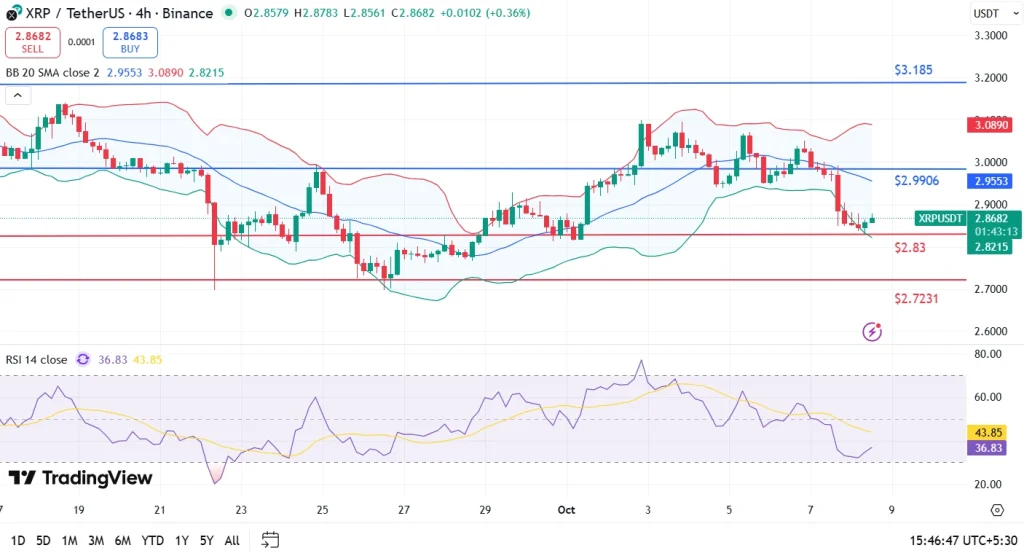
XRP is currently experiencing a significant correction phase. The cryptocurrency has fallen 3.55% in the last 24 hours and 2.77% over the week, now hovering around $2.86. This drop comes after a failed attempt to reclaim the $3 threshold, a major psychological level for bulls.
The first crucial support level sits at the 100-day exponential moving average (EMA), currently positioned at $2.85. This technical level acts as a barrier against an accelerated downtrend. If XRP closes below this threshold on a daily basis, sellers could take control and push the price toward $2.72, which represents last month’s low.
If the bearish movement continues, the 200-day EMA around $2.63 would represent the next major support. Momentum indicators confirm this fragility: The RSI at 44.63 remains well above the oversold zone, suggesting there is room for additional decline before a potential technical rebound. Moreover, XRP being surpassed by BNB in terms of market capitalization constitutes a negative psychological signal for holders.
To reverse the trend, bulls must absolutely regain control above $2.90, then aim for a decisive close above $3.
Stellar XLM, Correction Accelerates
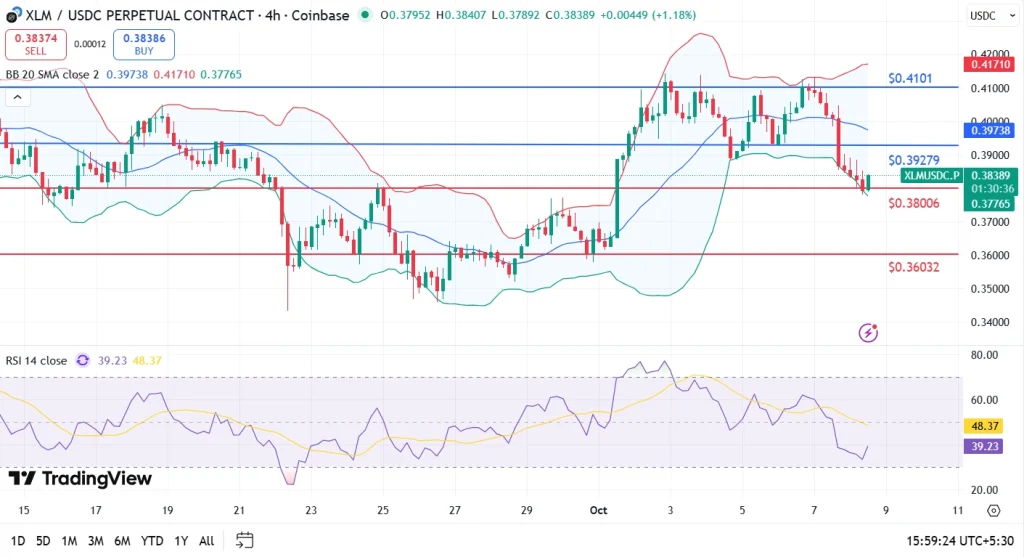
Stellar (XLM) has not escaped the selling pressure hitting altcoins. With a drop of 4.77% on the day, the token is currently trading at $0.382, completely erasing the October 6 rebound that had briefly propelled it above $0.41.
The technical structure of XLM shows concerning signs of weakness. The price has fallen below the 7-day simple moving average (SMA) at $0.399 and below the 30-day SMA at $0.384, confirming increasing downward pressure. The RSI at 46.88 indicates declining momentum while the MACD histogram, barely positive, suggests that bullish energy is rapidly depleting.
The loss of the pivot zone at $0.392 represents a significant technical turning point. This level served as a short-term sentiment marker, and its downward breach opens the door to further corrections. If the support at $0.38 gives way, the next bearish target sits at $0.36, a zone that held well at the end of September.
For Stellar to reverse course, a recovery above $0.392 accompanied by a close above the 30-day SMA is essential. Meanwhile, caution remains the watchword for traders positioned on this token.
Passionate about cryptocurrencies since 2019, I cover the latest news through clear and accessible articles. My goal is to make crypto understandable for everyone, with reliable and well-researched content.
DISCLAIMER
This article is for informational purposes only and should not be considered as investment advice. Some of the partners featured on this site may not be regulated in your country. It is your responsibility to verify the compliance of these services with local regulations before using them.
DISCLAIMER
This article is for informational purposes only and should not be considered as investment advice. Trading cryptocurrencies involves risks, and it is important not to invest more than you can afford to lose.
InvestX is not responsible for the quality of the products or services presented on this page and cannot be held liable, directly or indirectly, for any damage or loss caused by the use of any product or service featured in this article. Investments in crypto assets are inherently risky; readers should conduct their own research before taking any action and invest only within their financial means. This article does not constitute investment advice.
Risk Warning : Trading financial instruments and/or cryptocurrencies carries a high level of risk, including the possibility of losing all or part of your investment. It may not be suitable for all investors. Cryptocurrency prices are highly volatile and can be influenced by external factors such as financial, regulatory, or political events. Margin trading increases financial risks.
CFDs (Contracts for Difference) are complex instruments with a high risk of rapid capital loss due to leverage. Between 74% and 89% of retail investor accounts lose money when trading CFDs. You should assess whether you understand how CFDs work and whether you can afford to take the high risk of losing your money.
Before engaging in financial or cryptocurrency trading, you must be fully informed about the associated risks and fees, carefully evaluate your investment objectives, level of experience, and risk tolerance, and seek professional advice if needed. InvestX.fr and the InvestX application may provide general market commentary, which does not constitute investment advice and should not be interpreted as such. Please consult an independent financial advisor for any investment-related questions. InvestX.fr disclaims any liability for errors, misinvestments, inaccuracies, or omissions and does not guarantee the accuracy or completeness of the information, texts, graphics, links, or other materials provided.
Some of the partners featured on this site may not be regulated in your country. It is your responsibility to verify the compliance of these services with local regulations before using them.
Get 6200 USDT with Bitget ! 🔥
Don't miss out on this offer !
Create your account now to unlock this exclusive reward