

The 365-Day Moving Average : The Ultimate Market Sentiment Barometer
The importance of this technical indicator cannot be understated. A look at price history reveals clear patterns that repeat throughout market cycles. The last time Bitcoin fell below this moving average was in December 2022, during the heart of the crypto winter.
Three months later, in March 2023, the price attempted to bounce back to reclaim this key level. The failure of this attempt triggered a prolonged year-long downtrend, a period marked by the collapse of FTX and the sector-wide liquidity crisis. It wasn’t until a strong bullish breakout above the 365-day moving average in March 2023 that the bear market officially ended.
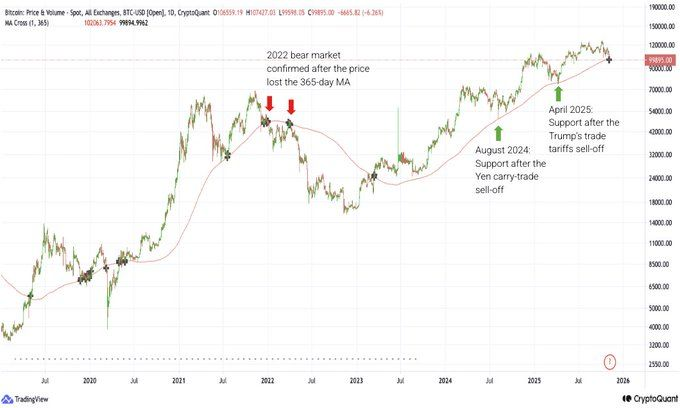
The sideways consolidation phase that followed this breakthrough lasted nearly a year before the bull run of late 2023 truly kicked in. This historical pattern suggests that losing this support is never insignificant and requires a rapid recovery to avoid a downward cascade.
During bullish trends, the 365-day moving average consistently acts as solid support. Two recent examples confirm this: in August 2024, during the massive liquidation of the yen carry-trade that caused a 10% drop in 24 hours, the price bounced precisely at this level. The same scenario played out in April 2025 after aggressive tariff announcements from Trump that shook global markets.
The Critical $100,000 Threshold : The Danger Zone
The situation becomes even more concerning when analyzing the “Distribution of Acquisition Cost of Top Buyers” metric recently highlighted by Glassnode. This on-chain data reveals that the average acquisition price for the upper quartile of high-cost buyers sits around $100,000.
This massive concentration of buyers in this price zone creates a major psychological and technical support level. Bitcoin hasn’t fallen below this level for two years, during which these investors have accumulated their positions. A decisive break below $100,000 would instantly transform these holders into potential sellers, creating amplified downward pressure.
Moreno is categorical in his warning: “The price must recross this threshold quickly.” This urgency is explained by the dynamics of moving averages. The longer the time spent below this level, the higher the probability of a sustained bearish trend. Technical traders are now watching price behavior in the coming days with extreme attention.
The increased volatility and exchange volume suggest the market is in a price discovery phase. Institutional buyers appear temporarily sidelined, likely waiting for support confirmation before redeploying capital. Data from Bitcoin spot ETF flows shows net outflows in recent days, confirming this institutional caution.

Sobre o mesmo assunto :

