What Are Trading Indicators & How to Use Them in 2026 ? Complete Guide
Explore the realm of technical indicators and master chart analysis in your trading. These tools are crucial for deciphering market trends and spotting opportunities. Learn about the top indicators and how to use them effectively to enhance your trading performance.
In the complex and dynamic world of cryptocurrency trading, technical analysis plays a predominant role for many investors seeking to anticipate market movements. At the heart of this discipline are technical indicators, essential mathematical tools derived from historical price and/or volume data of an asset.
Whether you’re in the Forex market, stocks, commodities or cryptocurrencies, these technical indicators provide valuable decision-making assistance.
It’s crucial to understand that most of these technical indicators are, fundamentally, just different visual representations of an asset’s past price evolution. By analyzing price history from different angles, these tools offer traders an enriched perspective, allowing them to better interpret market psychology and the forces at play.
Why Use Them ?
The main objective when using technical indicators is to attempt to detect patterns, trends, and signals that might suggest the probable future direction of price. They are also fundamental for identifying potential entry and exit points to optimize trading positions.
The approach based on technical indicators is distinctly different from fundamental analysis. While the latter focuses on the intrinsic value of an asset by examining economic, financial, technological factors or those related to the project (such as market capitalization, development team, underlying technology, partnerships, etc.), technical analysis postulates that all relevant information is already reflected in the price and its history.
Technical analysts therefore focus exclusively on charts and price movements to evaluate the future potential of a financial asset, relying heavily on signals provided by various technical indicators.
Different Types of Indicators
Technical indicators are often classified into two main families :
Overlays (or superimposed indicators)
Oscillators
Overlays, as their name suggests, are displayed directly on top of the price chart. Well-known examples include Moving Averages or Bollinger Bands. They often help visualize the trend or dynamic support and resistance levels.
Oscillators, on the other hand, usually appear in a separate window, below or beside the main chart. They have their own scale, often bounded (for example, from 0 to 100 for RSI or the Stochastic Oscillator). These technical indicators are particularly useful for measuring momentum, identifying overbought or oversold conditions, and spotting potential divergences.
Top 10 Technical Indicators in Trading
After understanding what technical indicators are and their general classification, it’s time to dive into the most used and appreciated tools by professional traders.
Although hundreds of technical indicators exist, some stand out for their popularity and perceived effectiveness. We’ve selected ten of the most relevant technical indicators for you. It’s important to note that mastering 2-3 technical indicators is often more profitable than superficially using a multitude of tools.
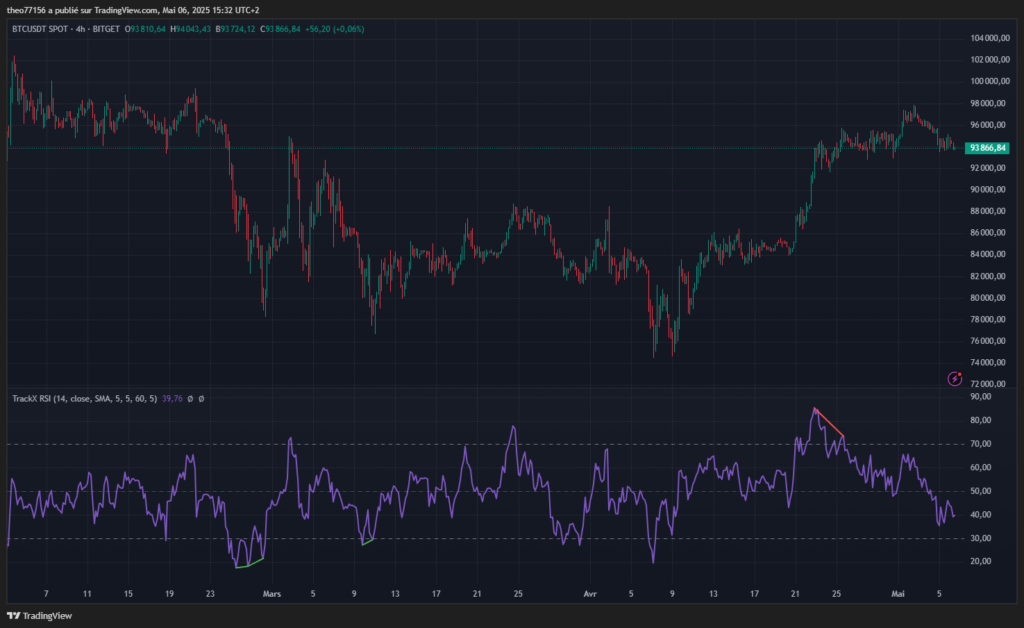
The Relative Strength Index (RSI) is arguably one of the most well-known oscillators. Developed by J. Welles Wilder, this technical indicator measures the magnitude of recent price changes to evaluate overbought or oversold conditions of an asset. The RSI oscillates between 0 and 100.
Traditionally, a value above 70 is considered an overbought signal, suggesting that the asset might be overvalued and a bearish correction is possible. Conversely, a value below 30 indicates an oversold condition, suggesting a potential bullish rebound.
RSI Bitcoin 4h
Beyond these levels, traders carefully monitor divergences between the RSI and price. A bullish divergence (price making a new low, but RSI making a higher low) can signal a bullish reversal, while a bearish divergence (price making a new high, but RSI making a lower high) can signal an imminent bearish reversal. The RSI is therefore a valuable technical indicator for assessing the strength and momentum of a trend.
2. Moving Averages (MA)
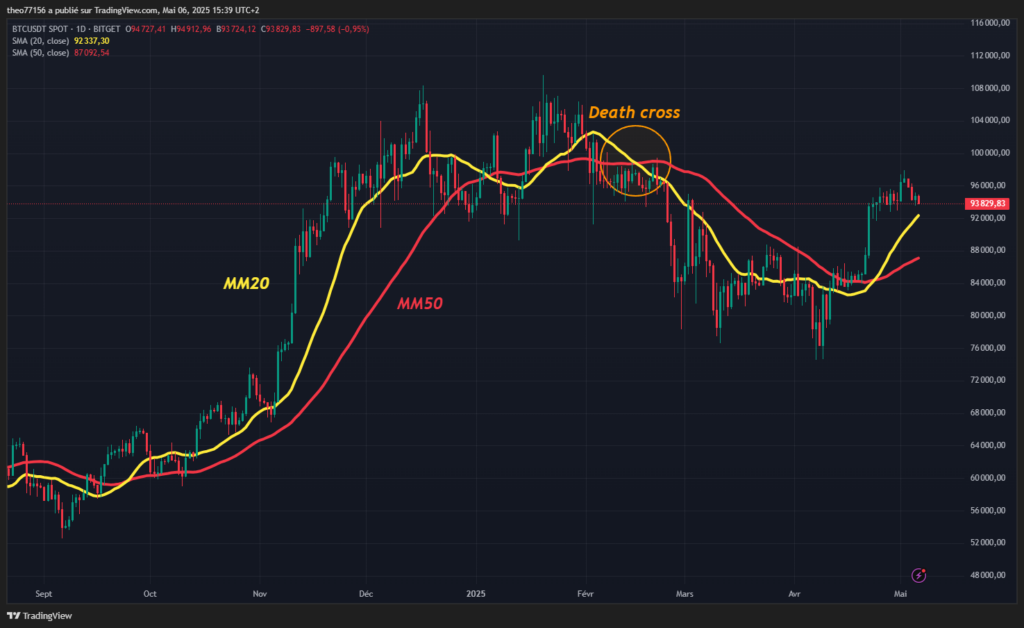
Moving Averages (MA) are overlay-type technical indicators among the most fundamental and widely used. They smooth price action over a defined period, thus helping to identify the direction of the general trend and filter market noise.
A Simple Moving Average (SMA) is calculated by averaging closing prices over a specified number of periods (for example, 20, 50, 100 or 200 days). An ascending MA suggests an uptrend, while a descending MA indicates a downtrend.
MA 20 & 50 – Bitcoin Daily
Moving average crossovers (for example, a short-term MA crossing above a long-term MA, known as a “golden cross”) are often interpreted as buy signals, and the reverse (“death cross”) as sell signals. MAs can also act as dynamic support or resistance levels.
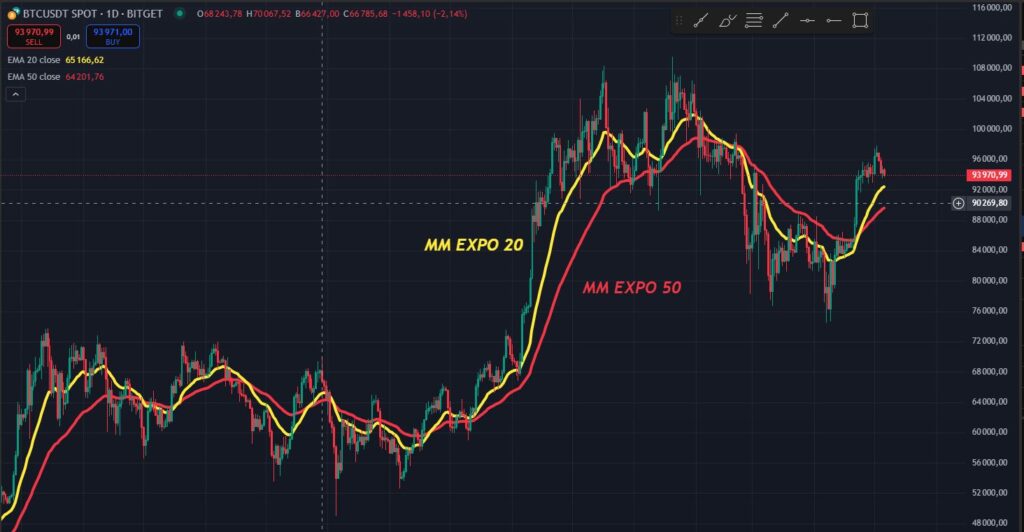
3. Exponential Moving Averages
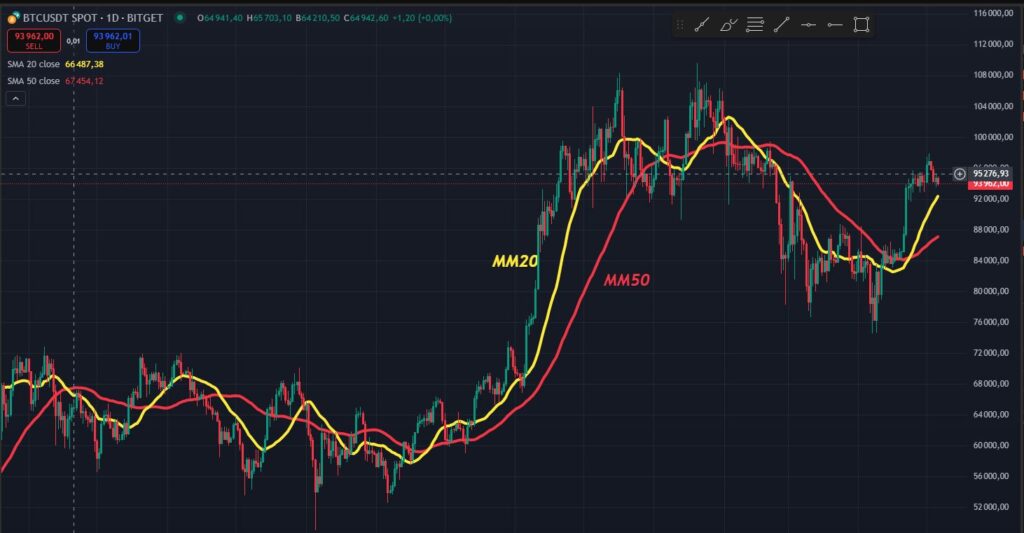
Exponential Moving Averages (EMAs) are a variation of simple moving averages. The key difference lies in their calculation : EMAs give more weight and therefore more importance to the most recent prices. This makes them more responsive to current price changes compared to SMAs, which give equal weight to all periods considered.
Simples Moving Averages 20 & 50
Exponential Moving Averages 20 & 50
This increased responsiveness can be an advantage for some traders looking for earlier signals, but it can also lead to more false signals in volatile markets. Like SMAs, EMAs are used to identify trends, spot crossover signals and serve as dynamic support/resistance levels. The choice between SMA and EMA often depends on the trader’s preference and strategy.
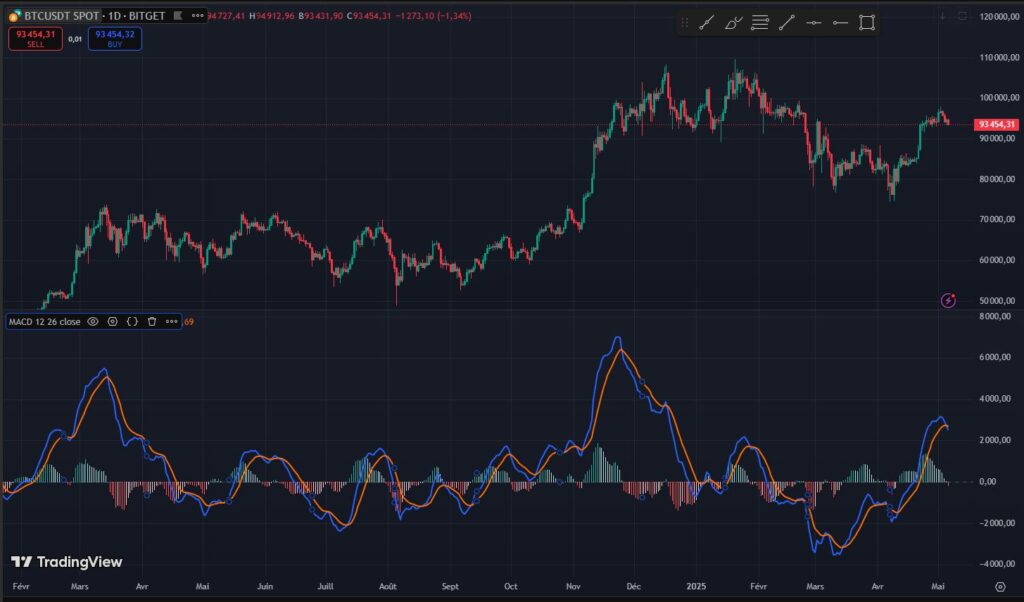
4. MACD (Moving Average Convergence/Divergence)
The MACD is another very popular momentum technical indicator, developed by Gerald Appel. It illustrates the relationship between two exponential moving averages of prices. The MACD consists of three main elements : the MACD line (the difference between the two EMAs), the signal line (an EMA of the MACD line, often over 9 periods) and the histogram (the difference between the MACD line and the signal line).
MACD – Btcusd daily
Traders use the MACD to identify changes in momentum, strength and direction of the trend. Crossovers of the MACD line with the signal line are common trading signals : a crossover above is often bullish, a crossover below is bearish.
The histogram helps visualize the strength of convergence (EMAs getting closer, weakening momentum) or divergence (EMAs moving apart, strengthening momentum). Divergences between the MACD and price, similar to those of the RSI, are also closely watched potential reversal signals.
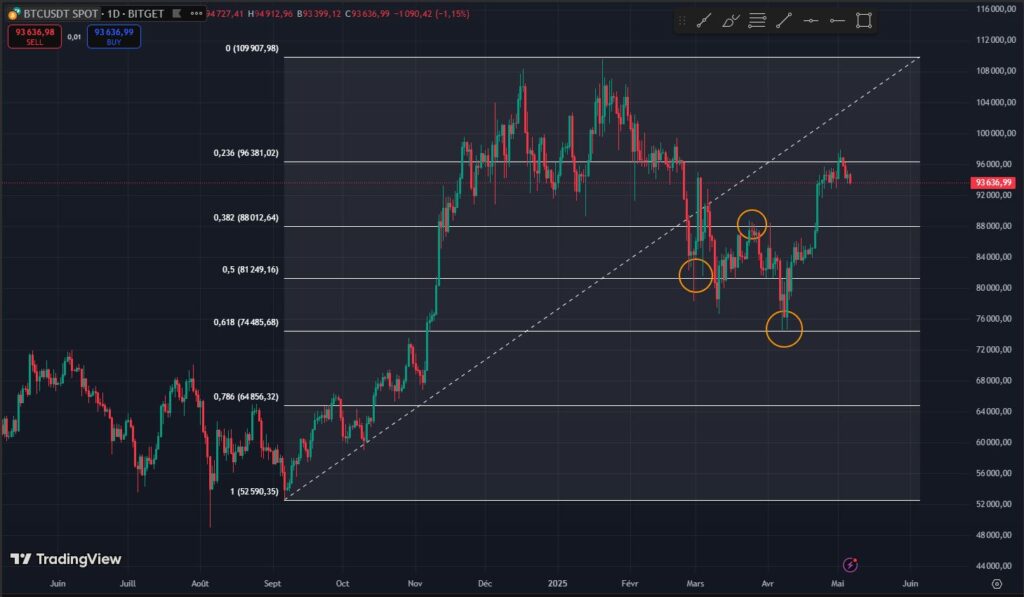
5. Fibonacci Retracements
Based on Leonardo Fibonacci’s famous number sequence and the golden ratio, Fibonacci retracements are not technical indicators in the classic sense (automatically calculated) but rather a drawing tool manually applied to a chart. They help identify potential support and resistance levels where the price might react after a significant movement.
To plot retracements, a major peak (swing high) and trough (swing low) are identified on the chart, then the tool draws horizontal lines at key Fibonacci levels : 23.6%, 38.2%, 50%, 61.8%, and 78.6% of the movement. The idea is that, following an impulse (rise or fall), the price tends to retrace part of this movement before resuming its initial trend.
Bitcoin Daily
These levels act as zones where traders can look for entry points in the direction of the trend or place stop-loss orders. Fibonacci extensions, a related tool, help project potential price targets.
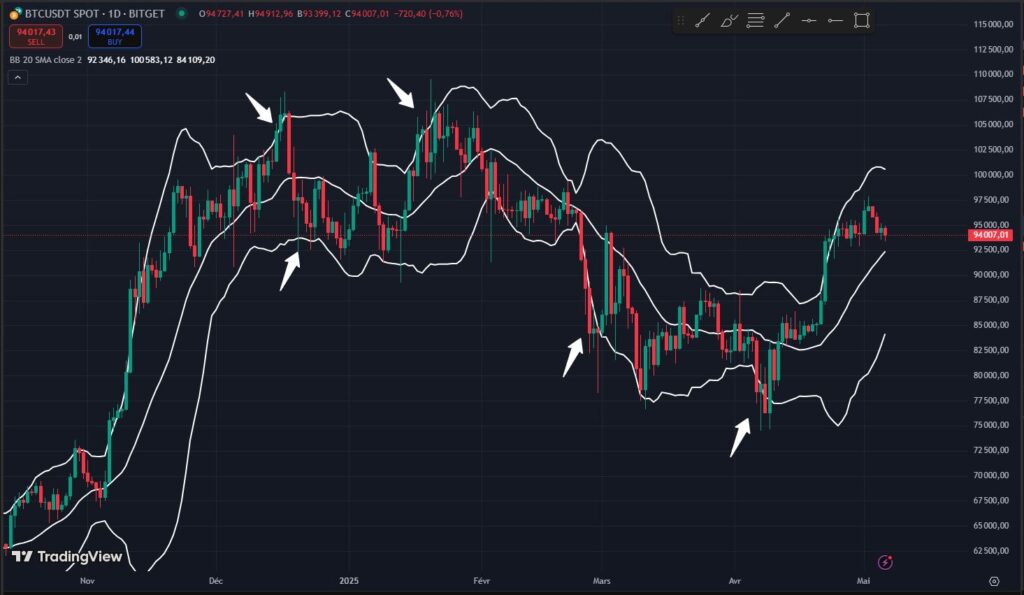
6. Bollinger Bands
Developed by John Bollinger, Bollinger Bands are an overlay-type volatility technical indicator. They consist of three lines : a simple moving average (typically over 20 periods) in the center, an upper band (the MA + 2 standard deviations) and a lower band (the MA – 2 standard deviations).
Standard deviation is a measure of volatility. Thus, the bands widen when volatility increases and narrow when volatility decreases (a “squeeze” period).
Price tends to move within these bands most of the time (about 90-95%). When the price touches the upper band, the asset may be considered relatively expensive or overbought in the short term, and when it touches the lower band, it may be considered cheap or oversold.
Bollinger Bands – Bitcoin daily
However, touching the bands is not in itself a reversal signal; in a strong trend, the price can “walk” along a band. Traders use the bands to assess volatility, identify relative overbought/oversold conditions and spot “squeezes” that often precede significant price movements.
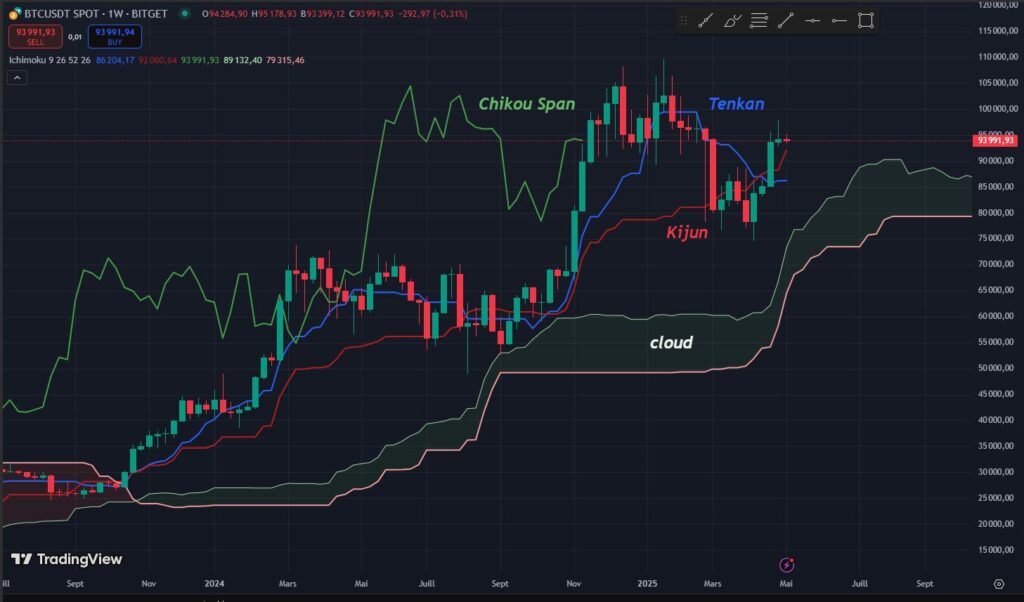
7. Ichimoku
Ichimoku Kinko Hyo, often simply called Ichimoku, is a comprehensive Japanese technical indicator that aims to provide a quick overview of trend, momentum and support/resistance levels (“see the balance at a glance”). It may seem complex at first due to its multiple lines, but it is highly appreciated by many traders.
It consists of five main lines : Tenkan-sen (conversion line), Kijun-sen (base line), Senkou Span A and Senkou Span B (which together form the Kumo or Cloud), and Chikou Span (lagging line).
Ichimoku – BTCUSD 1W
The Cloud is particularly important : when the price is above the cloud, the trend is considered bullish; below, it is bearish; inside, the market is considered to have no clear trend. The cloud itself acts as a support and resistance zone. Crossovers between Tenkan-sen and Kijun-sen provide trading signals, while the position of the Chikou Span relative to past price helps confirm the trend.
It’s a powerful technical indicator system but requires some learning time.
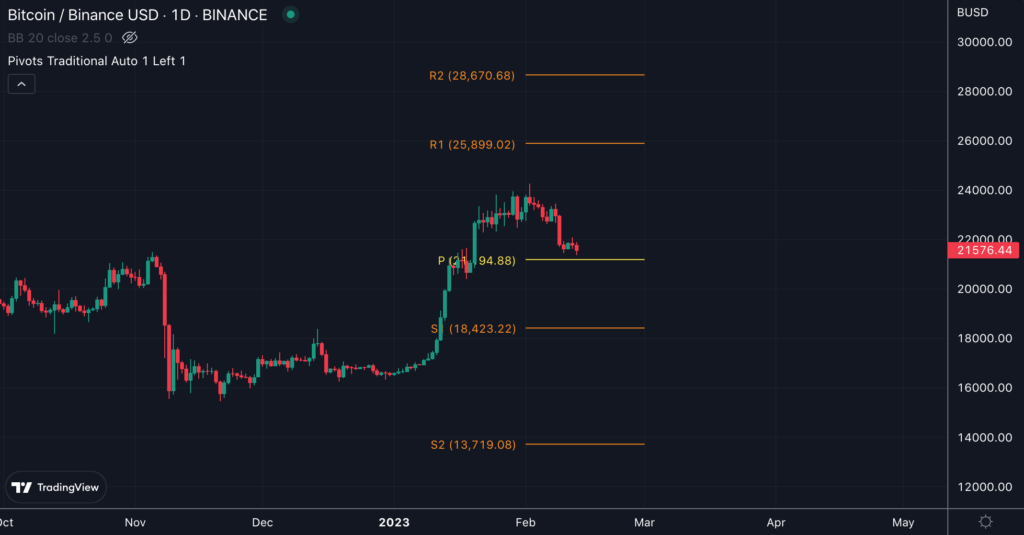
8. Pivot Points
Pivot Points are support and resistance levels calculated based on the high, low and closing prices of the previous period (often daily, but also weekly or monthly). They are particularly popular with day traders and scalpers for identifying key intraday levels.
The basic calculation gives the central Pivot Point (PP). From this PP, several resistance levels (R1, R2, R3…) above and several support levels (S1, S2, S3…) below are calculated. The idea is that the price will tend to fluctuate around the PP and test these support and resistance levels during the session. Traders use these levels to define entry points, profit targets and stop-loss levels.
Pivot Points
A decisive break of a pivot level may indicate a continuation of the movement towards the next level. It’s a relatively simple technical indicator to understand and use.
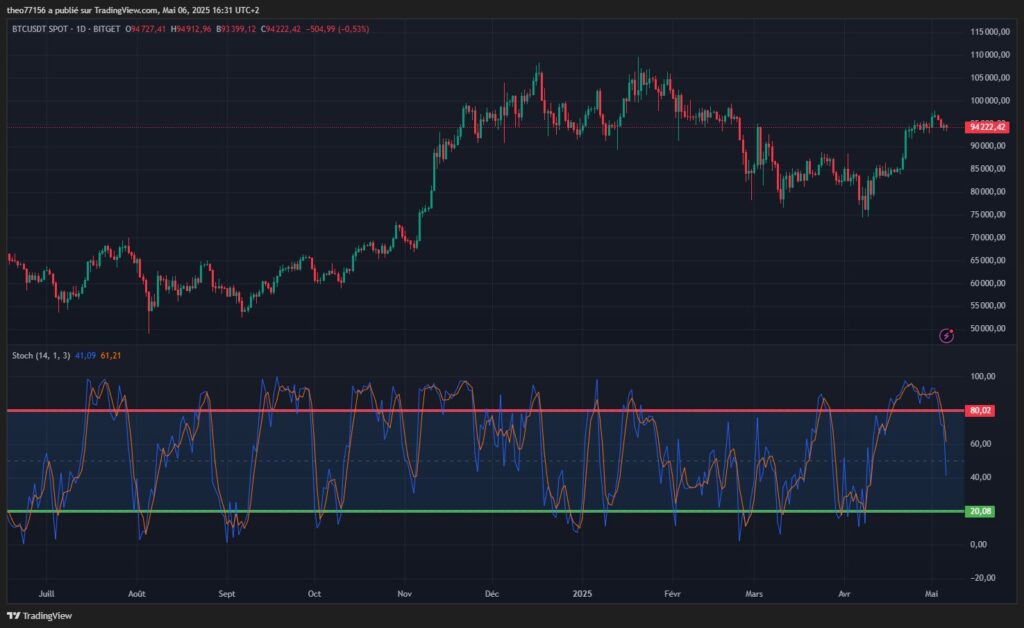
9. Stochastic Oscillator
The Stochastic Oscillator, developed by George Lane, is another oscillator-type momentum technical indicator, similar to RSI in its goal of identifying overbought and oversold conditions. It compares an asset’s closing price to its price range (difference between the highest and lowest) over a given period (often 14 periods).
It consists of two lines : the %K line (the main stochastic line) and the %D line (a moving average of the %K line, typically over 3 periods). Like the RSI, it oscillates between 0 and 100. Readings above 80 are considered overbought, while readings below 20 are considered oversold.
Stochastic Oscillator – Btcusd Daily
Trading signals are often generated by crossovers of the %K and %D lines in these extreme zones (a bullish crossover below 20, a bearish crossover above 80). Divergences between the stochastic oscillator and price are also important potential reversal signals to watch.
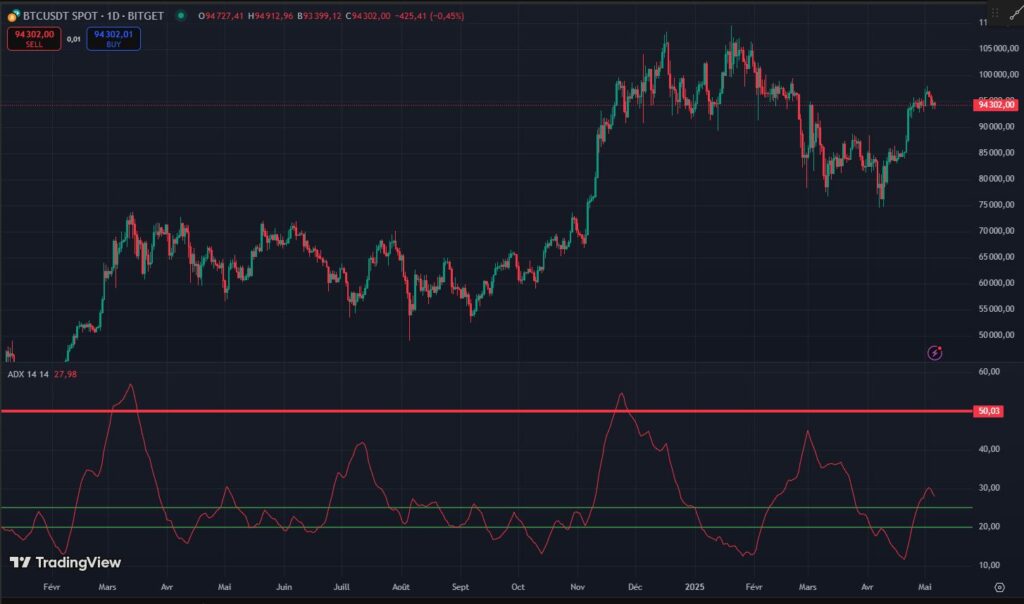
10. Average Directional Index (ADX)
The Average Directional Index (ADX), also developed by J. Welles Wilder (the creator of RSI), is a unique technical indicator because it primarily measures the strength of a trend, not its direction. It is often used to determine whether a market is in a strong trend or moving in a range (consolidation).
The ADX is derived from two other indicators : the Positive Directional Indicator (+DI) and the Negative Directional Indicator (-DI). The +DI measures the strength of the upward movement, and the -DI measures the strength of the downward movement.
The ADX itself is a line that typically oscillates between 0 and 100. An ADX value below 20 or 25 suggests a weak trend or a trendless market (range). An ADX value above 25 indicates a strengthening trend, and values above 50 signal a very strong trend.
It’s important to note that the ADX doesn’t tell whether the trend is bullish or bearish; you need to look at the relative position of the +DI and -DI lines for that (if +DI > -DI, the trend is bullish; if -DI > +DI, it’s bearish). Traders use the ADX to filter trades, favoring trend-following strategies when the ADX is high and range strategies when the ADX is low.
Faced with the multitude of available technical indicators, a question frequently arises among traders, especially beginners : is there a supreme technical indicator, the most reliable of all?
The honest answer is no. There is no Holy Grail among technical indicators, no tool guarantees 100% accurate predictions. The cryptocurrency market, like any financial market, is influenced by a multitude of factors, making any forecast inherently uncertain.
The perception of the reliability of a technical indicator largely depends on several subjective and contextual elements. Each trader develops their own preferences based on their trading style (scalping, day trading, swing trading, long-term investment), risk tolerance, and personal experience.
A technical indicator that works well for one trader in certain market conditions (for example, a strongly trending market) may prove less relevant for another trader or in a different market phase (for example, a range market). Additionally, the configuration of the technical indicator parameters (the periods used for calculations, for example) can greatly influence the signals generated.
Rather than seeking the unique and perfect technical indicator, the most judicious approach consists of deeply understanding the functioning of a few technical indicators and learning to interpret them correctly in different contexts. Above all, the combination of several uncorrelated technical indicators is often recommended to obtain confirmations and filter false signals.
For example, a trader might use a moving average to identify the main trend, the RSI to assess momentum and overbought/oversold conditions, and Bollinger Bands to gauge volatility. The convergence of signals from different technical indicators increases the probability of making an informed trading decision.
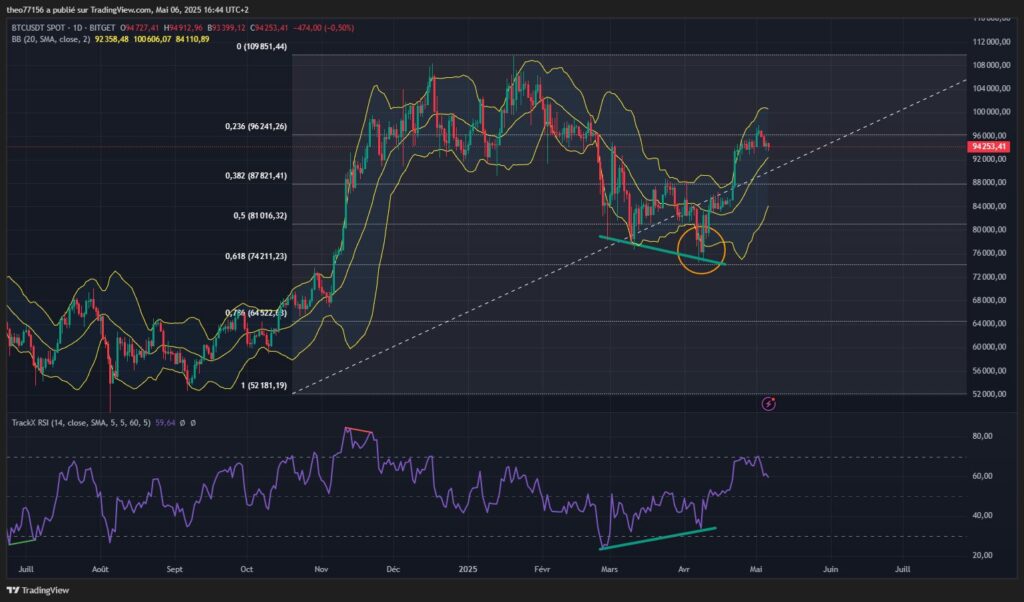
Bitcoin daily – Tradingview
In this example, we see in the orange circle that the market was in the reloading zone (0.618) of the Fibonacci retracement. We also notice a Bollinger Band excess coupled with a bullish divergence in the RSI. These 3 combined indications point towards a potential market trend reversal. Via shorter timeframes, all we need to do is look for our entry point to position ourselves for an upward move.
The Case of Custom Trading Indicators
Beyond the standard technical indicators available on most trading platforms, there exists a vast world of custom technical indicators. Many traders and developers create their own tools or modify existing indicators to better match their specific strategies or to try to gain an edge in the market.
Platforms like TradingView, with its Pine Script scripting language, greatly facilitate the creation, sharing, and use of these custom technical indicators.
The main advantage of these custom tools is their potential for very fine adaptation to a trader’s specific needs or to the particular characteristics of a market or asset. A custom technical indicator can combine several concepts, filter signals in a unique way, or visualize data in an innovative way.
However, the use of custom technical indicators also has disadvantages and risks. Their development requires programming skills and a deep understanding of technical analysis concepts. Additionally, an indicator that seems to perform well on paper or on past data (phenomenon of over-optimization or curve-fitting) may not perform well in real market conditions.
It is therefore essential to approach custom technical indicators with caution. Rigorous backtesting over a long historical period and on different assets is essential to evaluate their robustness and relevance. One should also be wary of “miracle” indicators sold or shared online, whose real effectiveness is often questionable.
For the majority of traders, solidly mastering standard technical indicators and understanding how to combine them effectively is a more reliable foundation than diving into the complexity of custom tools without proven expertise.
Be Cautious About Your Level of Confidence in Trading Indicators
While technical indicators are powerful tools that can provide valuable information about potential price movements, it is fundamental to understand their limitations and not to place blind trust in them. No technical indicator, however sophisticated, is a crystal ball capable of predicting the future with certainty.
They are based on past data and, although history tends to repeat itself in certain forms, financial markets, and particularly the cryptocurrency market, are subject to unforeseen events and volatility that can invalidate technical signals.
A common danger, especially for less experienced traders, is falling into the trap of over-optimization (looking for the perfect combination of indicators and parameters that would have worked marvelously in the past) or over-trading (taking too many positions based on every small signal generated by the indicators). This can lead to significant losses, as signals are not always reliable and transaction costs accumulate.
So How Should You Proceed ?
To maximize the benefits of technical indicators while minimizing risks, it is advised not to use a dozen simultaneously, which would be counterproductive and lead to analysis paralysis.
Most professional traders agree that it’s better to focus on 3, 4, or at most 5 indicators, but to master them perfectly. Understanding their strengths, weaknesses, and how they interact is essential.
Finally, if you want to maximize your chances, we advise you to always couple technical analysis tools together and thus confirm the indications they give you. For example, using support and resistance with a technical indicator such as RSI or Bollinger Bands can be very useful for detecting trend continuations or reversals.
More importantly, the use of technical indicators should always be part of a global trading strategy including solid risk management (defining stop-loss, appropriate position size) and good trading psychology (discipline, patience, emotional control).
Léa is a member of the InvestX team, dedicated to guiding users through their learning journey. Passionate about cryptocurrencies, she closely follows market trends. On InvestX.fr, Léa writes articles to help readers decode the latest news and stay informed about the ever-evolving blockchain world.
FAQ : Everything You Need to Know About Technical Indicators in Trading
What are the most commonly used technical indicators in crypto ?
Some of the most popular technical indicators include RSI, MACD, Moving Averages (simple and exponential), Bollinger Bands, and Fibonacci retracements. The best choice depends on your strategy and personal preferences.
How do you choose the right technical indicators ?
Selecting technical indicators depends on your trading style and market conditions. It’s better to master a few indicators deeply than to use too many. Combining them can help confirm signals.
Can you rely solely on technical indicators for trading ?
No, technical indicators are decision-support tools but not foolproof. It’s essential to use them alongside proper risk management, market context analysis, and a solid overall strategy.
How many technical indicators should you use at the same time ?
There’s no strict rule, but most traders recommend using no more than 3 to 5 technical indicators at once. Using too many can lead to confusion or “analysis paralysis.”
Where can you find technical indicators ?
Most trading platforms and charting tools (like TradingView or the ones integrated into crypto exchanges) offer a wide range of built-in technical indicators ready to be added to your charts.
DISCLAIMER
This article is for informational purposes only and should not be considered as investment advice. Trading cryptocurrencies involves risks, and it is important not to invest more than you can afford to lose.
InvestX is not responsible for the quality of the products or services presented on this page and cannot be held liable, directly or indirectly, for any damage or loss caused by the use of any product or service featured in this article. Investments in crypto assets are inherently risky; readers should conduct their own research before taking any action and invest only within their financial means. This article does not constitute investment advice.
Risk Warning : Trading financial instruments and/or cryptocurrencies carries a high level of risk, including the possibility of losing all or part of your investment. It may not be suitable for all investors. Cryptocurrency prices are highly volatile and can be influenced by external factors such as financial, regulatory, or political events. Margin trading increases financial risks.
CFDs (Contracts for Difference) are complex instruments with a high risk of rapid capital loss due to leverage. Between 74% and 89% of retail investor accounts lose money when trading CFDs. You should assess whether you understand how CFDs work and whether you can afford to take the high risk of losing your money.
Before engaging in financial or cryptocurrency trading, you must be fully informed about the associated risks and fees, carefully evaluate your investment objectives, level of experience, and risk tolerance, and seek professional advice if needed. InvestX.fr and the InvestX application may provide general market commentary, which does not constitute investment advice and should not be interpreted as such. Please consult an independent financial advisor for any investment-related questions. InvestX.fr disclaims any liability for errors, misinvestments, inaccuracies, or omissions and does not guarantee the accuracy or completeness of the information, texts, graphics, links, or other materials provided.
Some of the partners featured on this site may not be regulated in your country. It is your responsibility to verify the compliance of these services with local regulations before using them.
Get 6200 USDT with Bitget ! 🔥
Don't miss out on this offer !
Create your account now to unlock this exclusive reward