Bitcoin faces resistance: Has it peaked at $79,400?
Bitcoin's rally stalls at $79,400. Is this the local peak? Get the latest analysis on price corrections and future predictions.


Bitcoin's rally stalls at $79,400. Is this the local peak? Get the latest analysis on price corrections and future predictions.
The crypto market has just suffered a spectacular halt. After a meteoric rise fueled by geopolitical uncertainties, Bitcoin hit a new 12 week high. However, the bullish momentum ran into an insurmountable wall of sellers.
Indeed, BTC is facing resistance at the top of its major 16H order block at $79,400. For now, every breakout attempt is being defended by smart money with their sell orders.
Currently trading around $77,500, BTC is showing a slight drop of 1.5% over the last 24 hours, with a trading volume exceeding $27 billion. This sudden retracement shows that profit taking was massive once the critical threshold was approached.
Technical analysis reveals that the $79,400 zone is acting as a major psychological and technical resistance. At this level, order books were saturated with short positions, stopping any breakout attempt dead in its tracks. Sellers defended this area fiercely, causing an immediate rejection.
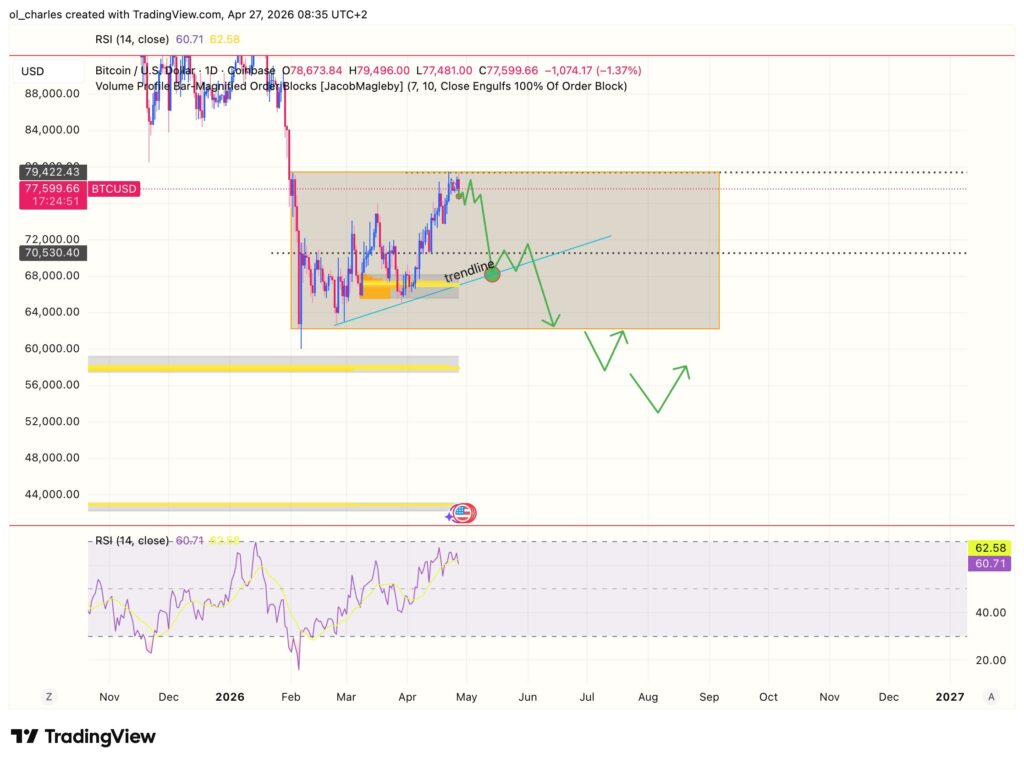
Momentum indicators, such as the RSI, are showing a triple bearish divergence on the 16H timeframe and a bearish divergence on the daily chart. These signals should not be ignored, especially since Bitcoin is getting rejected from the top of its range.
If the bulls fail to regain control quickly, this zone could become a glass ceiling. In this context, a return to the daily accumulation order block around $68,000 could occur in the coming weeks.
If this scenario unfolds, BTC would then sit on its major bullish trendline at $68,000. A downward breakdown of this line could send BTC plunging to the bottom of its range at $62,000. And if the drop continues and it loses this range bottom, BTC could head to $58,000 to $59,000 by July or August, or even lower towards $52,000.
Faced with this correction, all eyes are turning to the lower support levels. The first line of defense for buyers is located around $75,000 to $73,000. This threshold will be crucial to maintain the bullish structure.
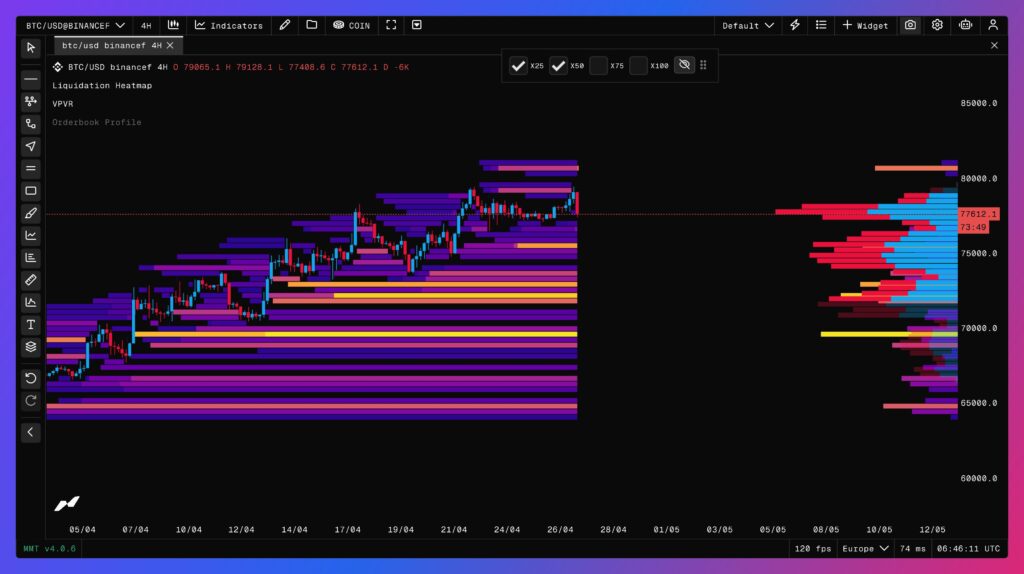
If this support gives way under pressure, BTC could slide towards $68,500, thereby invalidating the positive momentum. Such a bearish scenario would likely trigger cascading liquidations in the derivatives markets, exacerbating the price drop. Indeed, massive clusters have formed to the downside all the way to $69,000.
Conversely, a clean bounce off these levels would confirm that the underlying trend remains intact. This would offer an excellent accumulation zone for whales before the next assault on the highs.
The question on everyone’s mind is whether this was just a “bear market rally” or the beginning of a new bullish phase.
Traders will need to closely monitor the weekly close to confirm the market direction. A resurgence in buying volume will be essential to hope to smash through the $80,000 mark in the coming days.
But it is worth remembering that Powell’s latest FOMC meeting takes place this Wednesday. Historically, these FOMC meetings mark the beginning of a new bearish trend. And the markets price in this meeting by pushing the price up before the results to execute a sell the news event.
According to trader Killa, the probabilities of an imminent drop are much higher than the opposite.
“We are currently 198 days into the start of the bearish cycle (forming the first trough in less than 112 days). Historically, forming a bottom takes more than 300 days.”
He adds to his arguments the fact that a return to the BTC ATH represents an upside of only 64% currently. This does not offer a good risk reward ratio. This could therefore deter many institutional investors and give sellers the upper hand over buyers at this level.
Will Bitcoin find the strength to break this wall of sellers, or is it preparing to plunge deeper towards its historical supports?
Sources:
Related Articles:

Charles Ledoux is a Bitcoin and blockchain technology specialist. A graduate of the Crypto Academy, he has been a Bitcoin miner for over a year. He has written numerous masterclasses to educate newcomers to the industry and has authored over 2,000 articles on cryptocurrency. Now, he aims to share his passion for crypto through his articles for InvestX.
DISCLAIMER
This article is for informational purposes only and should not be considered as investment advice. Trading cryptocurrencies involves risks, and it is important not to invest more than you can afford to lose.
InvestX is not responsible for the quality of the products or services presented on this page and cannot be held liable, directly or indirectly, for any damage or loss caused by the use of any product or service featured in this article. Investments in crypto assets are inherently risky; readers should conduct their own research before taking any action and invest only within their financial means. This article does not constitute investment advice.


Risk Warning : Trading financial instruments and/or cryptocurrencies carries a high level of risk, including the possibility of losing all or part of your investment. It may not be suitable for all investors. Cryptocurrency prices are highly volatile and can be influenced by external factors such as financial, regulatory, or political events. Margin trading increases financial risks.
CFDs (Contracts for Difference) are complex instruments with a high risk of rapid capital loss due to leverage. Between 74% and 89% of retail investor accounts lose money when trading CFDs. You should assess whether you understand how CFDs work and whether you can afford to take the high risk of losing your money.
Before engaging in financial or cryptocurrency trading, you must be fully informed about the associated risks and fees, carefully evaluate your investment objectives, level of experience, and risk tolerance, and seek professional advice if needed. InvestX.fr and the InvestX application may provide general market commentary, which does not constitute investment advice and should not be interpreted as such. Please consult an independent financial advisor for any investment-related questions. InvestX.fr disclaims any liability for errors, misinvestments, inaccuracies, or omissions and does not guarantee the accuracy or completeness of the information, texts, graphics, links, or other materials provided.
Some of the partners featured on this site may not be regulated in your country. It is your responsibility to verify the compliance of these services with local regulations before using them.
