

81 days of negative funding rates: An unprecedented cycle
According to K33 Research, the current dynamics of Bitcoin are structurally different from the devastating cycles of 2014, 2018 and 2022. Vetle Lunde, Head of Research at K33, states that the $60,000 low hit in February represents the maximum drawdown of this cycle. This conclusion is based on an in depth analysis of on chain data and derivative markets. The main reason put forward is an exclusively pessimistic market sentiment that paradoxically protects against a violent capitulation. When everyone is already bearish, there are no sellers left to convince.
Derivatives data concretely confirm this thesis. Funding rates have remained negative for 81 consecutive days, a record in the recent history of the crypto market. Unlike previous crashes where excess leverage fueled dizzying drops, traders are now adopting an extremely defensive posture. This lack of bearish overexposure drastically limits the risks of a cascading liquidation. The fear and greed index remaining in persistent fear territory is paradoxically the most constructive signal for structural buyers.
Instead of a collapse, K33 analysts anticipate a healthy consolidation phase between $60,000 and $75,000. The market is slowly digesting recent movements, building a solid foundation before potentially initiating a massive new bull run. This controlled retracement helps cleanse the ecosystem without triggering a downward spiral. The underlying crypto trend remains bullish on timeframes exceeding 6 months. The Bollinger Bands are squeezing around this area, signaling an imminent explosion in directional volatility.
BlackRock and MicroStrategy lock in the $60,000 level
If the $60,000 floor seems indestructible, it is thanks to an institutional safety net unprecedented in Bitcoin history. Pension funds, hedge funds and public companies have never been so exposed to Bitcoin. US Spot Bitcoin ETFs, led by BlackRock and its iShares Bitcoin Trust, are absorbing selling pressure with formidable efficiency. These institutional vehicles create a permanent structural demand that did not exist during previous bear cycles. Institutional liquidity is now the primary market stabilizer.
MicroStrategy continues to massively accumulate Bitcoin, reinforcing the scarcity of the asset on exchanges. With 843,738 BTC in its treasury representing over 4% of the total supply, Michael Saylor‘s company mechanically removes sellable liquidity from the market. Institutional crypto whales accumulating silently at these levels create a cumulative supply shock that is difficult for sellers to counterbalance. This concentration of long term holding is structurally different from previous cycles dominated by retail investors. The fundamental analysis of Bitcoin has never shown such a solid holder profile.
For K33 Research, this silent accumulation is the warning sign of an imminent breakout. Sellers are gradually exhausting themselves against an institutional demand that shows no signs of weakening. Once the turbulence zone is cleared and liquidity returns, Bitcoin will have a clear path to soar. open interest data shows that speculators are stepping back, reducing the risk of downward manipulation. The slightest favorable macro spark could trigger buying pressure that would be difficult to contain.
The $60k to $75k zone as a launchpad?
The technical analysis of BTC confirms the thesis of K33 Research. The $60,000 to $75,000 area constitutes a major confluence zone between historical horizontal support and Fibonacci levels at 61.8% of the last bullish cycle. The weekly RSI is gradually climbing back from the oversold territory, without yet showing overbought conditions. The MACD shows the early signs of a bullish crossover on higher timeframes. These technical convergences support the hypothesis of a reversal currently in consolidation.
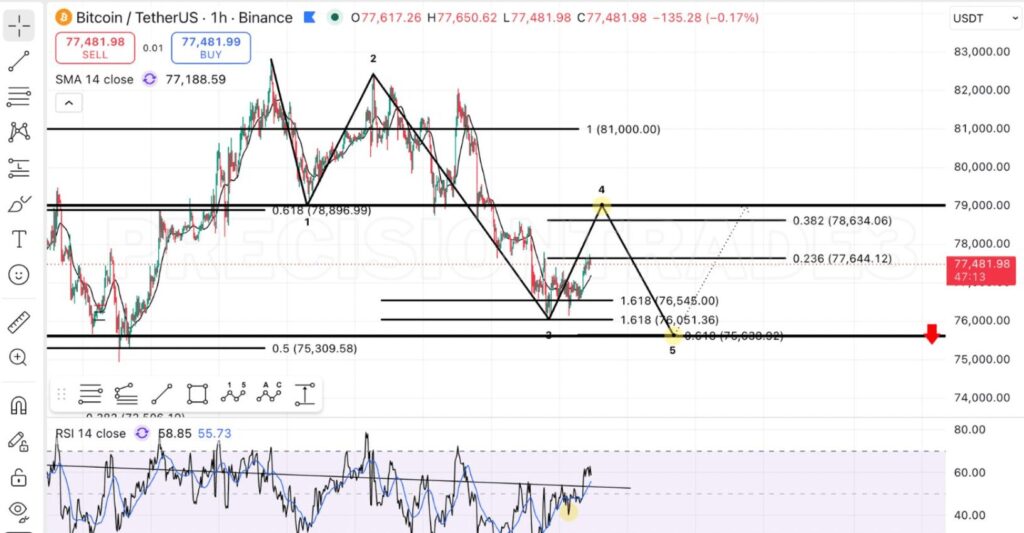
The psychological resistance of $75,000 is the first hurdle to clear to validate the optimistic scenario of K33. A weekly closing breakout above this level with convincing volume would open the road toward $83,000 and then the previous ATHs. The $60,000 support/resistance now represents the absolute floor of this cycle according to derivatives analysis. The Elliott Waves suggest that the market is at the end of a corrective wave before a new bullish impulse. The CVD is starting to show a deceleration in net selling pressure over the last few weeks.
The weekly Ichimoku places the resistance cloud between $78,000 and $82,000 as the next major obstacle. An upward breakout from this cloud would constitute a classic institutional buy signal in traditional financial markets. Traders engaged in swing trading are progressively positioning their entries between $72,000 and $75,000 with stops below $58,000. The current setup is reminiscent of the January 2023 bounce that preceded the +150% rally toward new ATHs. History does not repeat itself but it often rhymes in crypto markets.
Will Bitcoin smash its ATH before the end of 2026?
The convergence of favorable catalysts has never been stronger for Bitcoin. The CLARITY Act currently being voted on in the US Senate will soon provide a clear regulatory framework that will legitimize massive institutional allocation. Negative funding rates for 81 days create the conditions for a potentially violent short squeeze if the price exceeds $80,000. Bearish speculators would then be forced to buy back their positions, mechanically amplifying the surge. The most optimistic Bitcoin forecast from K33 Research points to a return to historical ATHs before the end of 2026. The 2025 to 2026 crypto bull run retains every chance of being extended.
For investors looking to invest in crypto through BTC in this context, a fractional accumulation between $72,000 and $65,000 remains the most prudent strategy. HODLing is fully justified for profiles with a time horizon exceeding 12 months, given the structural catalysts identified by K33. Securing positions in a hardware wallet like Ledger remains essential in the face of persistent volatility. The gold vs Bitcoin comparison is increasingly leaning in favor of BTC as an institutional store of value. Anticipating crypto taxation on potential capital gains will be a priority as soon as the reversal is confirmed.
The main risk remains a prolonged macro deterioration that would delay the reversal. A global bear market triggered by a US recession could test the strength of the $60,000 floor identified by K33. In this scenario, lower levels would constitute additional entry points for high conviction investors. The coming weeks around the $75,000 to $80,000 resistance will be decisive. The BTC price prediction for the end of 2026 remains largely positive for analysts incorporating the institutional thesis of K33 Research.
Sources:
- K33HQ on X
- Tradingview
- inteliviewKR on X
Related Articles:

