

Is the Bitcoin rally losing its main growth driver?
The price of Bitcoin is currently navigating within a price zone between $76,500 and $77,900, displaying contained volatility over the last 24 hours. However, behind this apparent stability, on-chain data reveals a concerning dynamic. Buyer participation on the spot market is weakening significantly, depriving the current rally of its essential fuel.
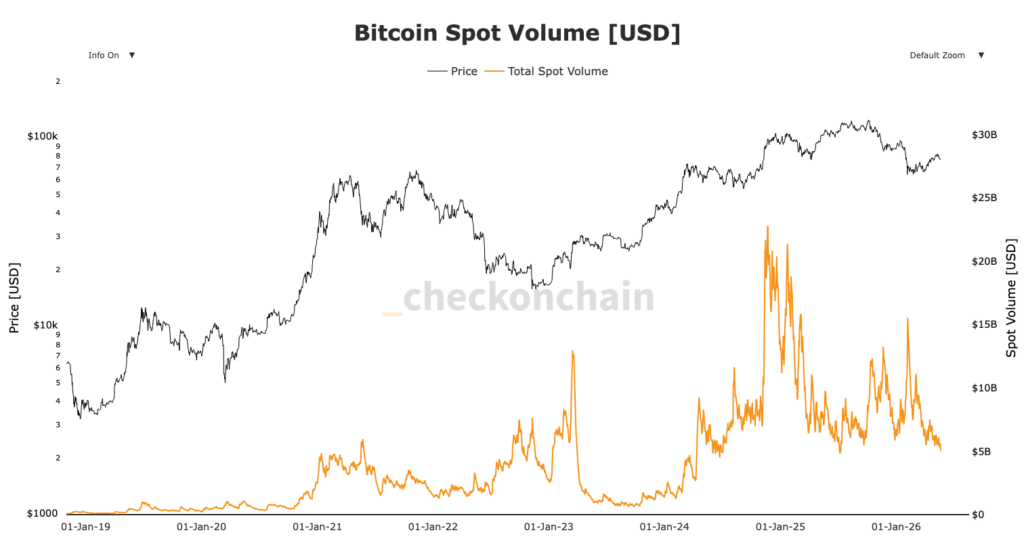
This drop in organic demand jeopardizes the overall recovery structure of BTC. Without a massive influx of new capital, attempts to breakout toward new highs risk being quickly stifled. Institutional traders and whales seem to be staying on the sidelines, thereby reducing the buying pressure needed to break through upcoming resistances.
Technical analysis confirms this underlying fragility. The RSI is showing signs of bearish divergence on higher timeframes, while the MACD is struggling to cross into positive territory with conviction. If the immediate support at $77,000 were to give way, the market could witness a deeper retracement, liquidating numerous long positions down to the $75,000 to $73,000 range.
Key levels to watch to avoid a bearish scenario
To maintain hopes of an extended bull run, Bitcoin must absolutely defend the $77,000 zone. A confirmed break below this psychological level would pave the way for a correction toward the next major support located around $73.48. This bearish scenario would be exacerbated by an increase in selling volumes, confirming that sellers have regained control.
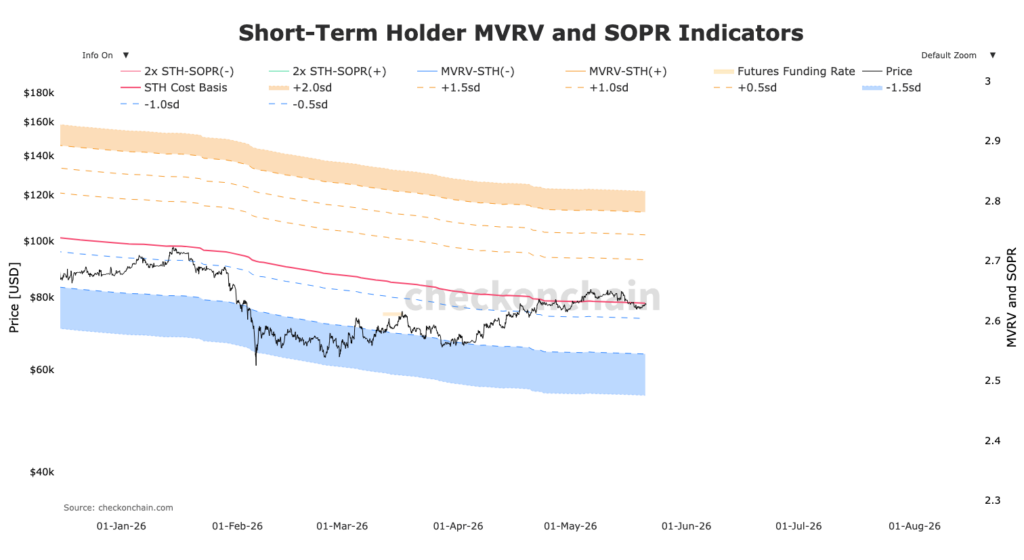
Indeed, Bitcoin has fallen back below the STH average purchase price at $78,100. Moreover, this price level has rejected Bitcoin three times today, signaling that this former support is now the resistance to break in order to reach higher highs.
This bullish scenario would require a strong comeback in spot demand to absorb the selling pressure. If buyers manage to defend $77,000 and propel the price beyond the local resistance of $78,100, BTC could target the $80,000 zone. This level represents a major technical hurdle before considering a new all time high (ATH).
The coming days will therefore dictate the trend for the upcoming weeks. A daily close below this $78,100 level and the probabilities of a return to $76,000 will be very high.
How far can the Bitcoin price fall if support breaks?
Faced with macroeconomic uncertainty and rising bond yields, risk assets like Bitcoin are under increased pressure. If spot demand does not wake up quickly, the probability of a brutal rejection increases. Traders are closely monitoring order books to anticipate the next massive directional move.
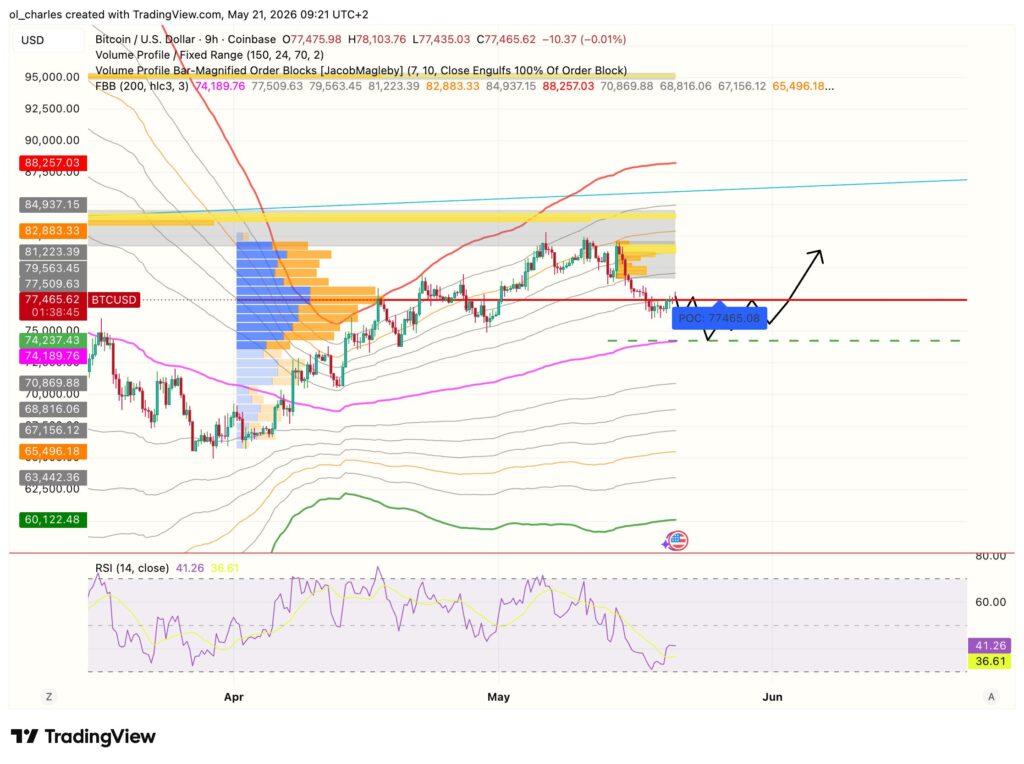
The 9H chart and the FBB indicate a support at $74,200. This support will be crucial for a bounce and to maintain hopes of a bullish rally. It will be necessary to watch for a bullish RSI divergence on the 9H timeframe as it recently bordered on oversold territory. Otherwise, BTC could drop below $70,000 in the following weeks.
In the event of a bounce, the $81,500 area is a high liquidity zone that could serve as a major resistance for BTC. A break of this level and BTC will head between $83,000 and $87,000 afterward. The $87,000 mark being its 2 year moving average 2Y SMA.
But the question is no longer just whether BTC can reach new highs, but whether it has the necessary fundamentals to consolidate its gains. A drop below $76,000 could trigger a cascade of liquidations, precipitating the price toward this $74,200 level. Investors must remain extremely vigilant in the face of this latent volatility.
As the market holds its breath, the ball is in the court of spot buyers. Will they manage to reverse the trend and restart the machine, or will we witness a necessary purge before the next bullish cycle?
Sources:
Related Articles:

