

Can Bitcoin Shatter the $75,000 Resistance?
The crypto market is suddenly catching fire. While geopolitical tensions had been weighing heavily on risk assets, growing hopes of an agreement between the United States and Iran have reignited investor appetite. As a result, Bitcoin (BTC) has kicked off a fresh rally, currently trading around $74,460. But is this new surge the real deal?
This renewed optimism has caught short sellers off guard. A massive $400 million short squeeze has liquidated short positions, propelling the price upward. This cascading liquidation phenomenon acts as high-octane fuel, forcing sellers to buy back their positions and thereby accelerating the current uptrend.
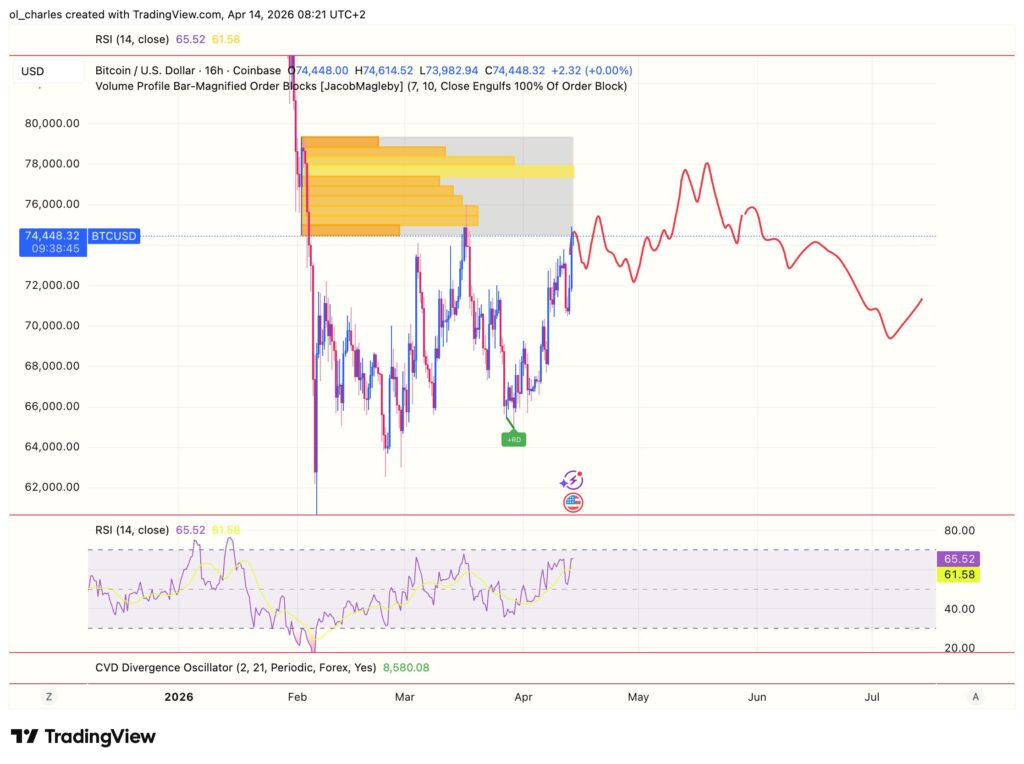
From a technical standpoint, Bitcoin is at a decisive crossroads. The $75,000 zone represents a major psychological and technical resistance. Indeed, it marks the bottom of Bitcoin’s previous HTF range along with the April 2025 bottom. If buyers manage to keep up the pressure and confirm a breakout above this level, the cryptocurrency could swiftly head toward the liquidity zone and major resistance between $76,000 and $80,000.
How High Can the Price of Bitcoin Soar?
Technical indicators, such as the RSI, show strong buying momentum, although a slight overheating is possible in the very short term. Since Bitcoin is testing this $75,000 resistance for the second time, a short-term rejection down to between $72,700 and $71,000 this week remains a possibility. Consolidating above these levels would allow Bitcoin to gather fresh momentum for an attempt to reach at least $76,000.
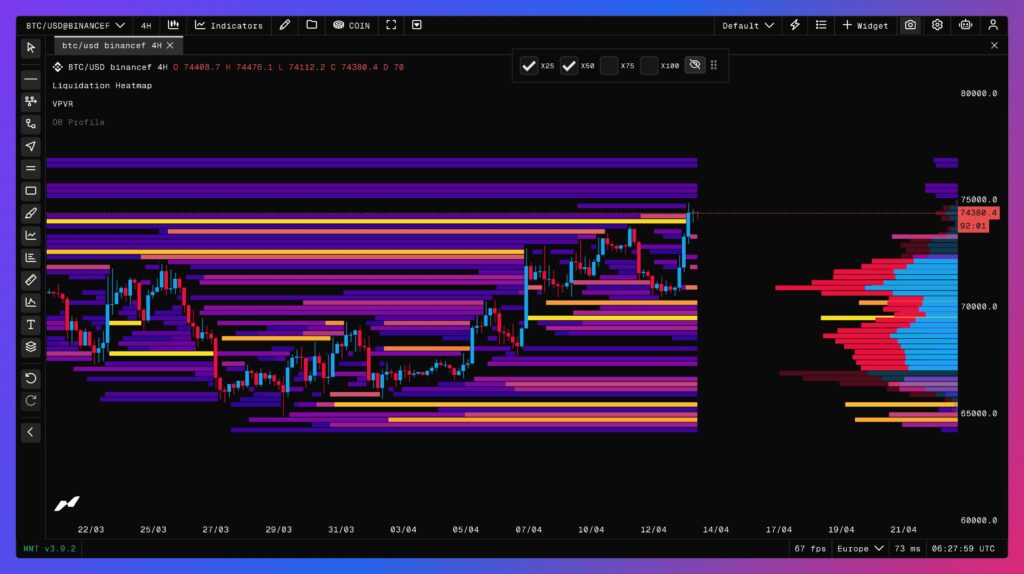
However, in the event of a persistent rejection below $75,000, a correction toward lower support zones, located around $70,000 to $69,000, cannot be ruled out. A substantial cluster of longs is present at this level. This retracement would allow the market to breathe and consolidate its foundation before making another breakout attempt toward uncharted highs.
This spectacular move demonstrates the market’s extreme responsiveness to geopolitical developments. But it also means the market remains heavily influenced by Trump’s highly unpredictable decisions. Volatility is therefore still very much present and could persist until these conflicts are resolved.
What the On-Chain Data Tells Us
Bitcoin ETFs are starting to bounce back. In fact, they have recorded two consecutive days of inflows for the first time in nearly a month, dating back to the local peak of $75,200 in March.
The ETF options market confirms this broader market indecision, showing a heavy concentration of puts around 60k as a hedge, alongside ambitious bets with calls reaching up to $160,000.
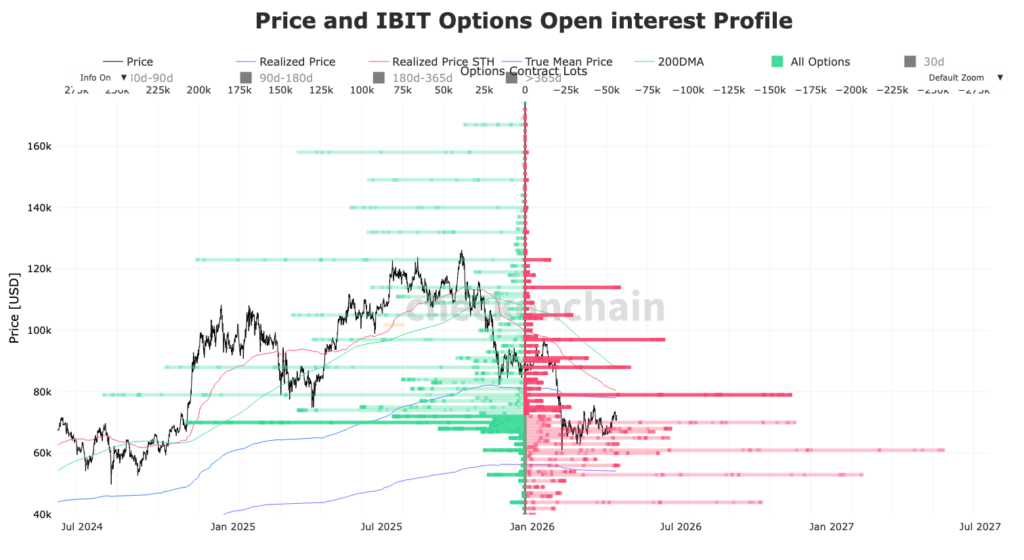
Yet, the 78k to 85k range is an absolute war zone among investors. It is a high-tension area where the slightest catalyst could trigger a violent move in either direction.
As for a BTC price target in the short to medium term, the $80k strike is a magnet. This is exactly where the maximum potential pain for IBIT ETF investors (max pain) is concentrated, which can exert a gravitational pull on the price.
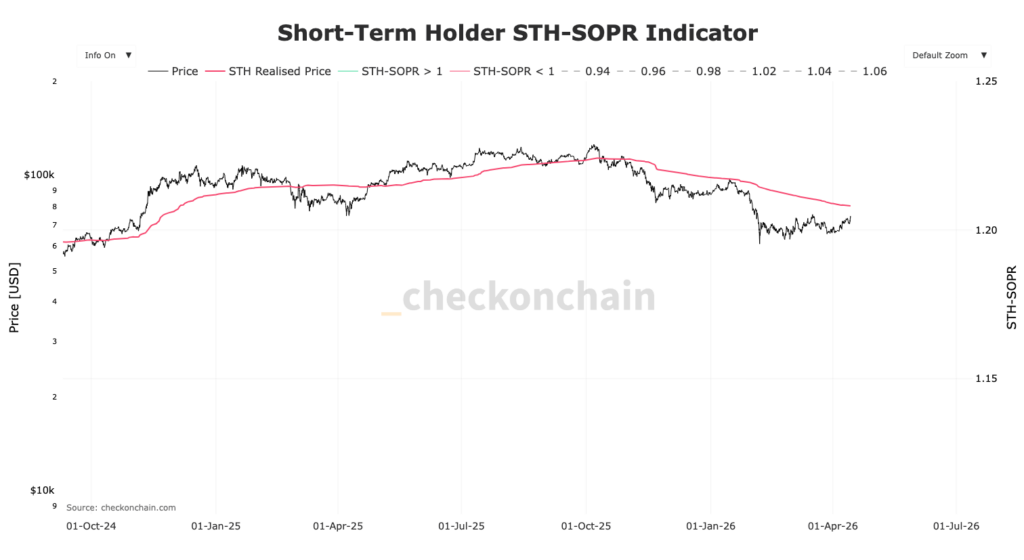
The $80,000 mark is also the average purchase price for short-term holders. It is therefore the crucial price point for determining Bitcoin’s direction in the coming months. A rejection at this level could see Bitcoin quickly fall back to $60,000 in the months ahead.
Sources:
Related Articles:

