

A massive rebound amid geopolitical tensions
The crypto market experienced a cold sweat this Monday following rumors of missile strikes in Iran, triggering a flash retracement. However, Bitcoin proved its resilience by absorbing the selling pressure to soar past $80,000. Currently, the price is navigating within a range between $80,300 and $81,000, confirming the strength of buyers at this key level.
Meanwhile, major altcoins like Ethereum (ETH), Solana (SOL) and Dogecoin (DOGE) remain stable, letting the king of cryptos dictate the trend. Options markets are showing intense activity, with institutional investors quietly betting on a bullish breakout. However, a certain degree of caution is still warranted, as the options skew indicates that many market participants continue to hedge against downside risk.
Nevertheless, the thesis put forward by Taiki Meida yesterday might just prove to be correct. According to him, there are no longer enough “marginal sellers” to push Bitcoin lower. Furthermore, the fact that Bitcoin withstood yesterday’s drop better than major tech stocks like NVIDIA suggests that Bitcoin is finally ready to catch up.
Is Bitcoin’s key support in danger?
From a technical analysis standpoint, holding the psychological support at $80,000 is crucial for what comes next. If buyers manage to consolidate this zone, it will serve as an ideal springboard to attack the upcoming resistances. The first target stands at $84,000. This area is highly anticipated by many traders looking to attempt a short position. So, could this slow down Bitcoin?
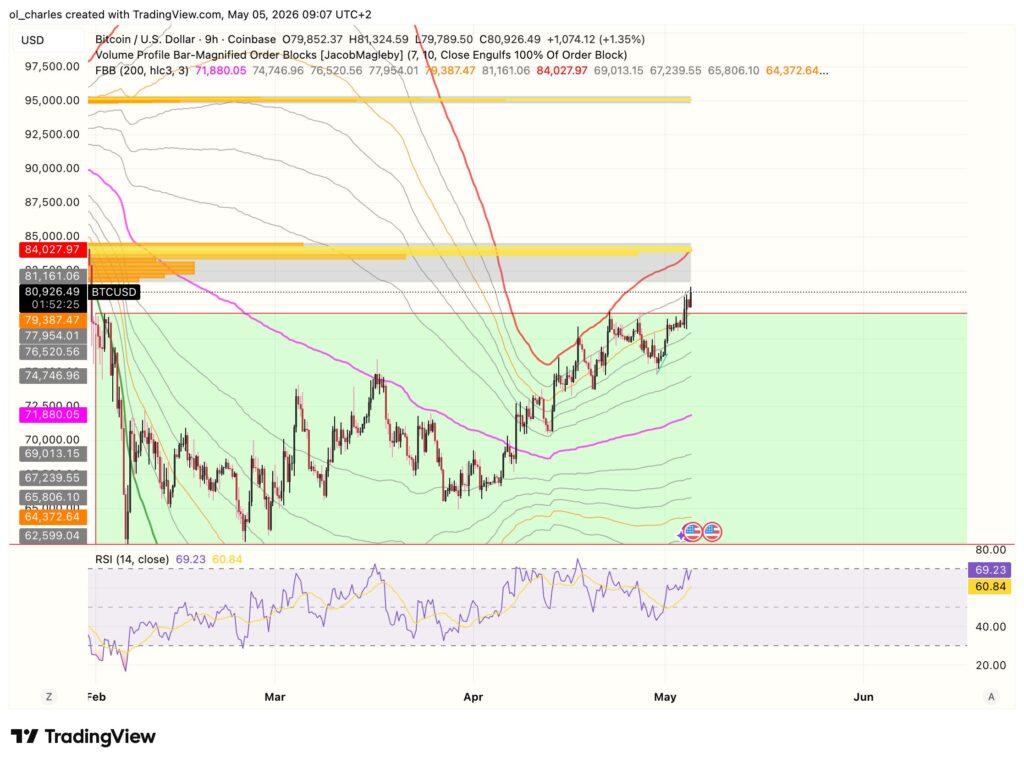
On a higher timeframe, Bitcoin primarily has a major target at $95,000 and its 1 week bearish order block. This zone is crucial and could significantly slow down BTC’s ascent. Nevertheless, a breakout above this area could reignite a swift rally toward $116,000.
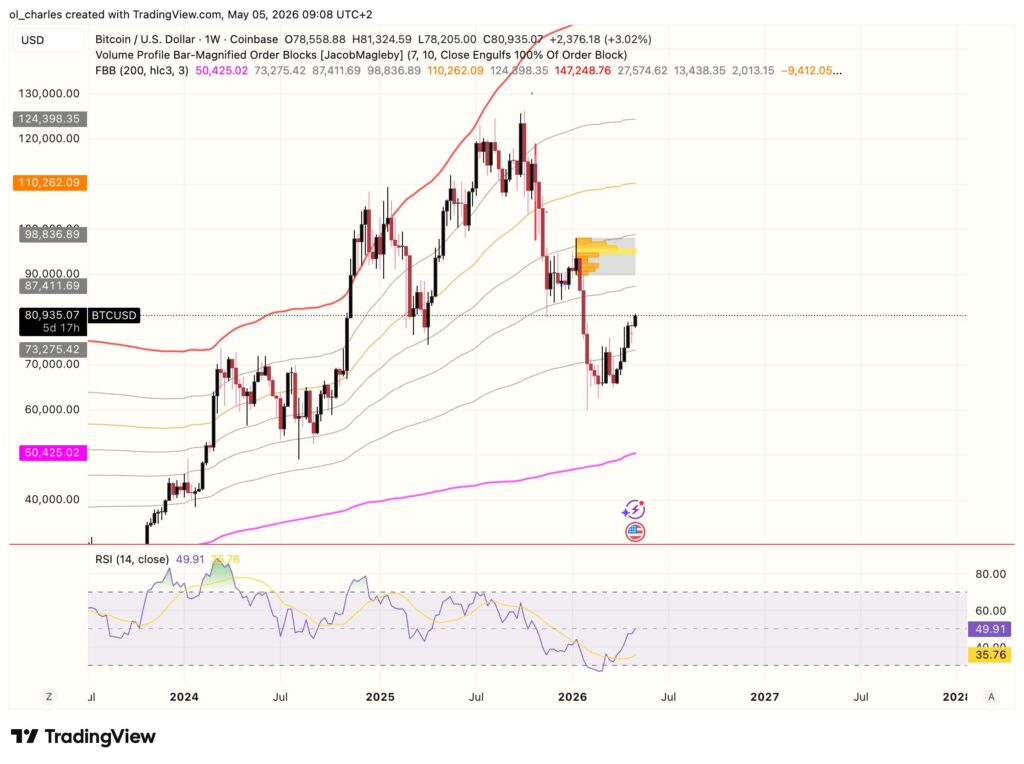
In the event of a bearish scenario, a break below $80,000 could drag the price back to lower support levels, notably around $78,000 or $76,000, where significant liquidations have recently occurred. Caution is therefore advised: although the current momentum is positive, the market remains sensitive to macroeconomic and geopolitical announcements that could trigger another sudden correction.
How high can the price of Bitcoin explode?
If the bullish scenario is confirmed and Bitcoin manages to break out of its current compression zone, the next major target is located around the resistance and the 200 day moving average at $83,400. A clean daily close above this level could pave the way for a new ATH, potentially propelling the price toward the next resistance at the STH Bollinger bands at $93,000. The area between $93,000 and $103,000 is a zone of extreme liquidity. A consolidation below this range could occur in the coming months in the event of an upward scenario.
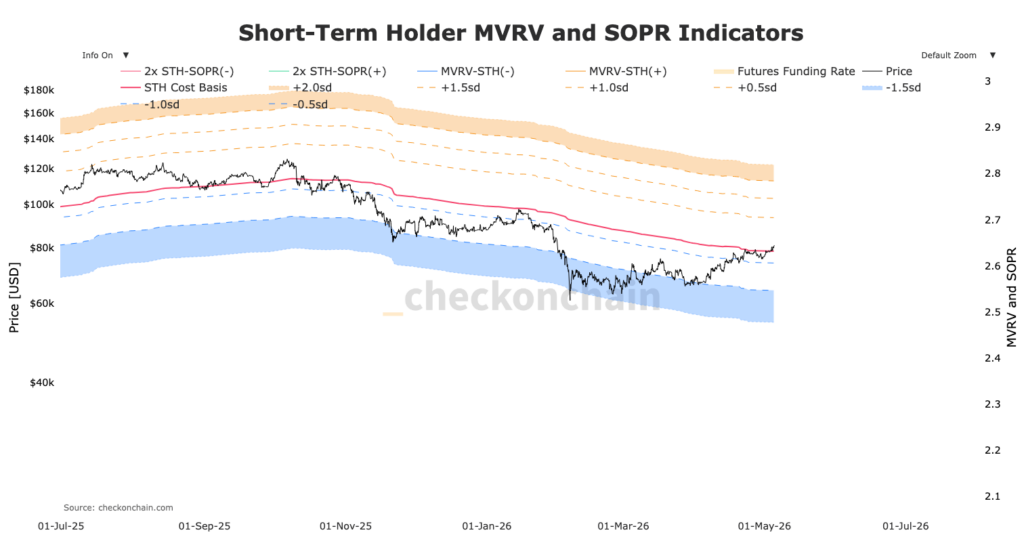
However, the battle between buyers and sellers is far from over. On chain data and the evolution of open interest in derivatives markets will be decisive in anticipating the next massive move. While institutional players continue to accumulate via ETFs, retail investors must remain attentive to reversal signals.
Is this the ideal time to position yourself before the next crypto market surge? It is worth remembering that Trump could reignite market tensions at any moment. Nevertheless, spot exposure to the best and most resilient cryptos should be favored if BTC holds $80,000 this week.
Sources:
Related Articles:

