Bitcoin Breaks $87,000 : What Are the Next Key Levels to Watch ?
Bitcoin is testing the $89,000 threshold amidst a persistent bearish market structure. Will it finally break out of the downward trend and reclaim $100,000? Explore market analysis and outlook.
After a strong rally over the weekend, Bitcoin finds itself at a technical crossroads. While this momentum has sparked hopes of a trend reversal, the underlying structure tells a more cautious tale that traders should not overlook.
Bitcoin (BTC) started the week with an impulsive move to the upside, breaking out of a short-term consolidation and sweeping liquidity above recent highs.
🚨Bitcoin est devenu haussier à court terme, depuis le MSS (Market Structure Shift)📈
Le setup ressemble actuellement à une réaccumulation de Wyckoff, mais la demand des 73,000$ n'a pas été touchée❌
Ce qui perd des probabilités pour une continuation haussière durable selon moi… pic.twitter.com/gsQug5wbyJ
Indeed, as indicated by Zoral, Bitcoin turns bullish in the short term after breaking the bearish trendline. The liquidation of short Stop Losses above this line leads to an acceleration in the price.
However, the Bitcoin trend remains bearish until it breaks above the high protected by smart money at $99,400.
A Break Above $99,500 Needed to Confirm a Structural Change
A legitimate trend reversal would require Bitcoin to surpass $99,500 convincingly, ideally supported by an increase in volume and momentum. Without this, the recent move is best viewed as a “stop hunt”, a hunt for stop losses and thus manipulation for smart money to sell at higher prices.
If the $86,000 level does not hold and the price starts to retreat, it opens the way for a liquidity sweep at $74,500, a level that has historically attracted demand but could be vulnerable in this context. Below that, the next significant support is at $67,850, marking a new lower low and confirming the ongoing bearish cycle.
@_Checkmatey_ says this isn’t the same Bitcoin market we saw in 2017, 2018, or 2023.
The shift? A growing institutional presence and more complex derivatives infrastructure are changing the way Bitcoin moves and how cycles behave. pic.twitter.com/DSzk7tQ4lb
According to analyst Checkmate, a drop below $65,000 (which corresponds to the average purchase price of all Bitcoin investors) would push holders into a selling panic, potentially driving Bitcoin towards $50,000 to $40,000.
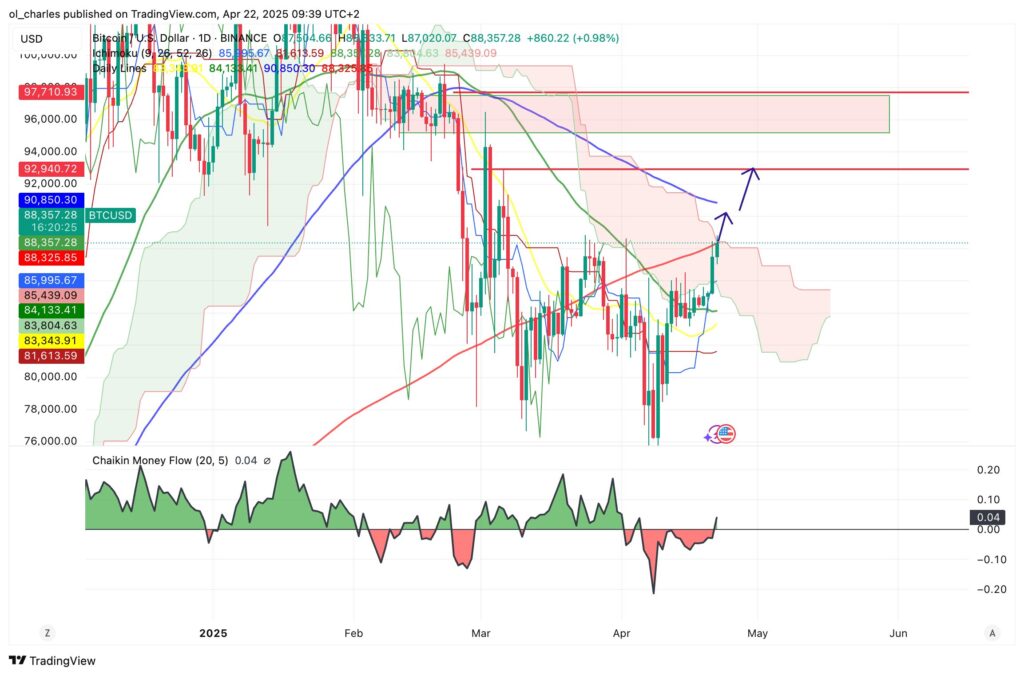
In the bullish scenario, Bitcoin will face a significant liquidity zone at $96,000, which will be a tough resistance to break. Before that, $92,800 represents the average buying price of short-term holders and $90,000 the 100-day moving average. These are the two major resistances ahead.
Currently, Bitcoin is facing the top of the Ichimoku cloud on the daily chart and its 200-day moving average.
Overall, this setup calls for caution among traders. While the bullish movement may seem strong on smaller timeframes, it lacks confirmation on longer-term structures.
The closer Bitcoin gets to this $96,000 zone, the higher the likelihood of a short-term bearish reversal. $90 and $92,800 are the next areas to watch.
Charles Ledoux is a Bitcoin and blockchain technology specialist. A graduate of the Crypto Academy, he has been a Bitcoin miner for over a year. He has written numerous masterclasses to educate newcomers to the industry and has authored over 2,000 articles on cryptocurrency. Now, he aims to share his passion for crypto through his articles for InvestX.
DISCLAIMER
This article is for informational purposes only and should not be considered as investment advice. Some of the partners featured on this site may not be regulated in your country. It is your responsibility to verify the compliance of these services with local regulations before using them.
DISCLAIMER
This article is for informational purposes only and should not be considered as investment advice. Trading cryptocurrencies involves risks, and it is important not to invest more than you can afford to lose.
InvestX is not responsible for the quality of the products or services presented on this page and cannot be held liable, directly or indirectly, for any damage or loss caused by the use of any product or service featured in this article. Investments in crypto assets are inherently risky; readers should conduct their own research before taking any action and invest only within their financial means. This article does not constitute investment advice.
Risk Warning : Trading financial instruments and/or cryptocurrencies carries a high level of risk, including the possibility of losing all or part of your investment. It may not be suitable for all investors. Cryptocurrency prices are highly volatile and can be influenced by external factors such as financial, regulatory, or political events. Margin trading increases financial risks.
CFDs (Contracts for Difference) are complex instruments with a high risk of rapid capital loss due to leverage. Between 74% and 89% of retail investor accounts lose money when trading CFDs. You should assess whether you understand how CFDs work and whether you can afford to take the high risk of losing your money.
Before engaging in financial or cryptocurrency trading, you must be fully informed about the associated risks and fees, carefully evaluate your investment objectives, level of experience, and risk tolerance, and seek professional advice if needed. InvestX.fr and the InvestX application may provide general market commentary, which does not constitute investment advice and should not be interpreted as such. Please consult an independent financial advisor for any investment-related questions. InvestX.fr disclaims any liability for errors, misinvestments, inaccuracies, or omissions and does not guarantee the accuracy or completeness of the information, texts, graphics, links, or other materials provided.
Some of the partners featured on this site may not be regulated in your country. It is your responsibility to verify the compliance of these services with local regulations before using them.
Get 6200 USDT with Bitget ! 🔥
Don't miss out on this offer !
Create your account now to unlock this exclusive reward