

An unmistakable hemorrhage
The eleven US spot Bitcoin ETFs recorded cumulative net outflows of approximately $1.257 billion over the five trading days from May 18 to 22, marking the continuation of a redemption streak spanning six consecutive sessions.
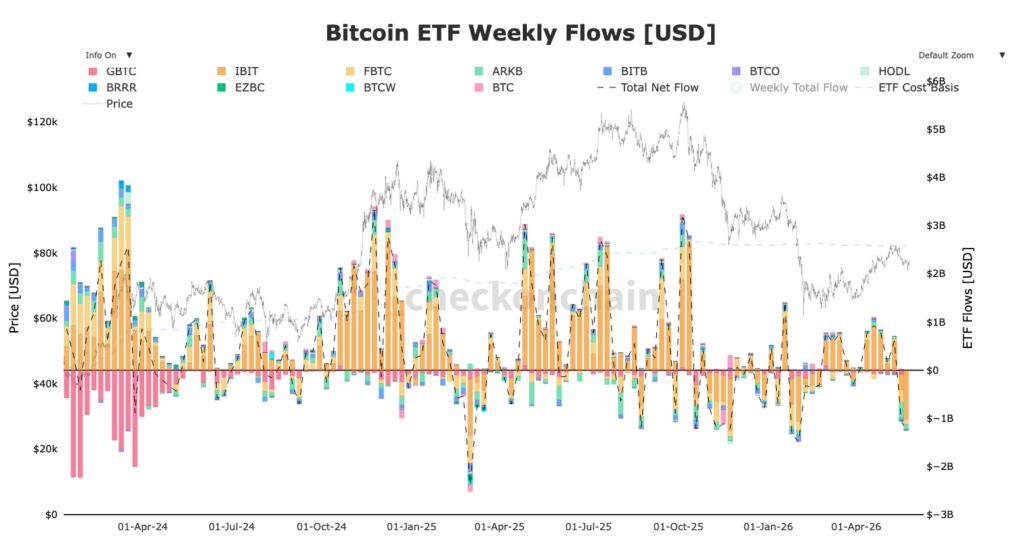
Selling pressure built up gradually, with Monday May 18 being the heaviest day, seeing $648.6 million in net outflows — one of the largest redemption days since January. The following day, outflows still reached $331.1 million, with BlackRock alone accounting for $325.6 million through its IBIT fund. The subsequent sessions posted more moderate figures — $70.5 million on May 20, then $105.2 million on May 22 — but the momentum remained clearly tilted to the downside.
Furthermore, Bitwise (BITB), Invesco (BTCO), Franklin Templeton (EZBC), VanEck (HODL) and Fidelity (FBTC) were among the other asset managers registering outflows. This nearly generalized selling front is a sign that the decision to reduce BTC exposure did not come from an isolated player, but rather from a fundamental shift in institutional allocations.
This makes it the most significant week of withdrawals since late January, marking a series of six consecutive days of outflows that began on May 15. As a reminder, April 2026 had been a high point for Bitcoin ETF adoption, with $2.44 billion in net inflows, representing the best monthly performance since October 2025. The reversal is brutal. And it also reflects the volatility and uncertainty regarding the direction of Bitcoin.
While Kalshi traders were predicting a return to 100k this year just a few weeks ago, they are now forecasting a drop to $54,000 in 2026.
The worrying institutional signal
Beyond the raw numbers, what stands out is the concentration of outflows on IBIT. BlackRock, which has embodied the institutional legitimacy of Bitcoin since the ETF approvals, finds itself at the heart of the liquidation. When IBIT recorded $448 million in outflows in a single session, this figure did not merely represent fund specific redemptions — it was a broader signal of institutional risk aversion.
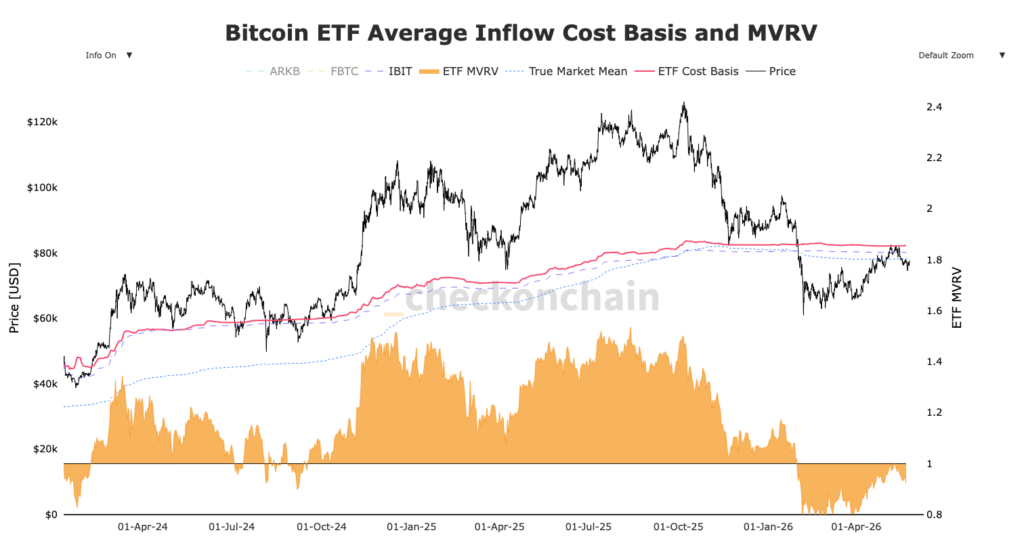
And this sell off is not insignificant. As the chart indicates, Bitcoin rejected perfectly at the average purchase price of Bitcoin ETFs at $82,000. The average purchase price of IBIT ETFs is, for its part, at $80,000, which constitutes a new resistance between $80,000 and $82,000.
Jane Street reduced its positions in Bitcoin ETFs by about 70% in the first quarter, while Goldman Sachs decreased its exposure by 10%. Players of this magnitude do not exit by accident. These positionings reflect macro allocation decisions, likely linked to the rise in US bond yields and persistent geopolitical uncertainty.
Nevertheless, despite the difficult week, when Bitcoin ETFs post two consecutive weeks of outflows as is the case here, it often corresponds to a local bottom. But nothing is certain and confirmation will come from the technical side. A single bounce and the ETFs will give in to FOMO.
Technical analysis: Bitcoin still ranging
On the charts, Bitcoin finds itself in a delicate setup. BTC is trending below its 50 day moving average at 77,200 and below the 6 hour and 9 hour order blocks up to $78,000. If Bitcoin fails to hold $77,200, a return to the 100 day MA around $73,600 in the coming weeks is highly probable.
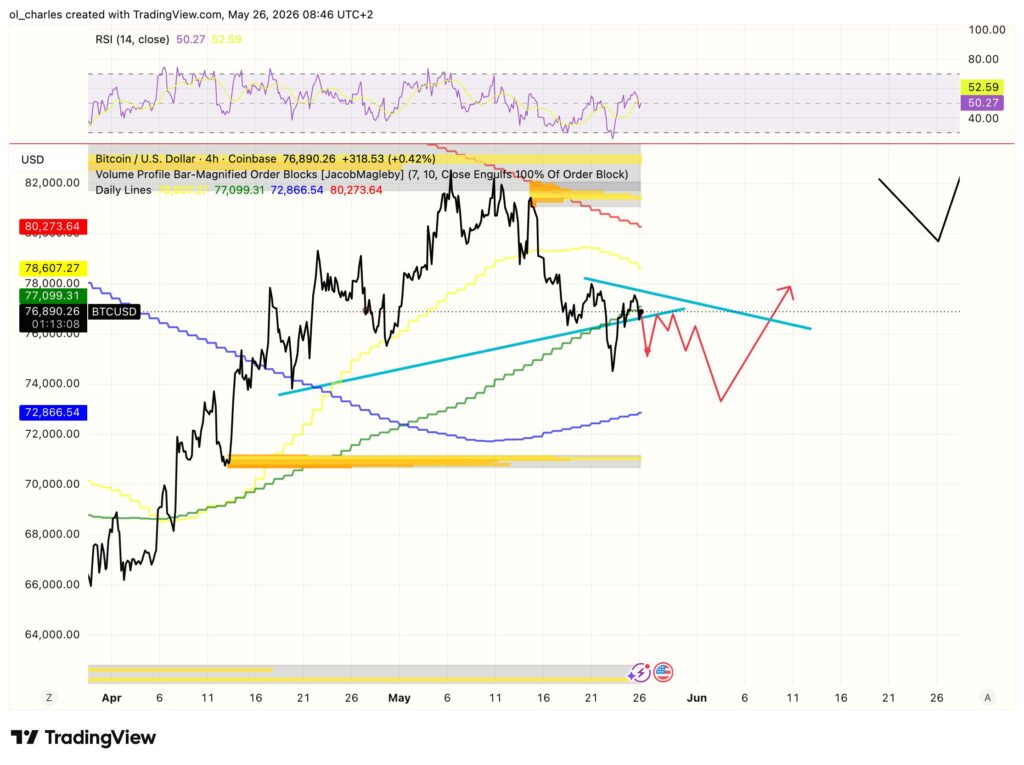
It will be necessary to monitor the 16 hour RSI and watch the oversold zone. For now, there is no clear directional signal other than a slow and probable return below $74,000.
Resistances are concentrated at 77,200, 80,000 and 82,000 dollars. The 80,000 to 81,900 dollar level remains the central psychological wall: as long as Bitcoin does not close above this threshold on the daily timeframe, the structure remains bearish or in slow capitulation. Below that, the key support lies between 73,800 and 72,800 dollars, an area where institutional buying has historically emerged and which constitutes the defensive floor to watch.
The POC at 77,200 is now the first short term resistance to monitor. As long as the price rejects from this level, weakness on BTC is still present.
What on chain data reveals
On chain data provides a more nuanced perspective. The MVRV Z Score sits at 0.41, placing Bitcoin in accumulation territory — far from the overheating zones typical of cycle tops. Historically, a Z Score below 1 indicates that the market is trading near or below its adjusted realized value, which provides a statistically favorable context for long term buyers.
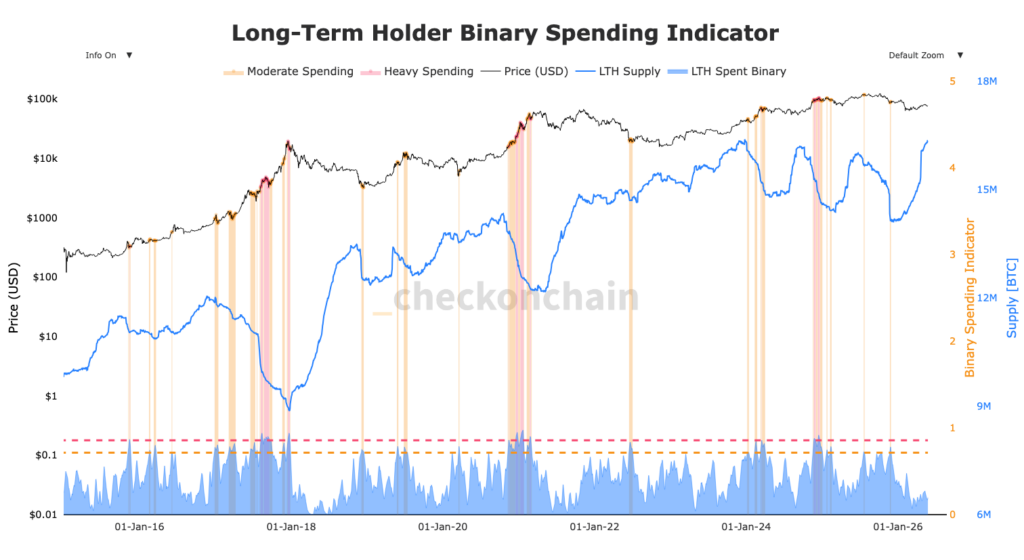
The behavior of LTH (Long Term Holders) also deserves attention. These diamond hands — defined as wallets that have not moved their BTC for over 155 days — continue to hold their positions without massive distribution. When LTH distribute aggressively, it is usually the signal of a cycle top. Here, their portfolio is still growing. It would be particularly interesting to know to what extent Saylor contributed to this increase.
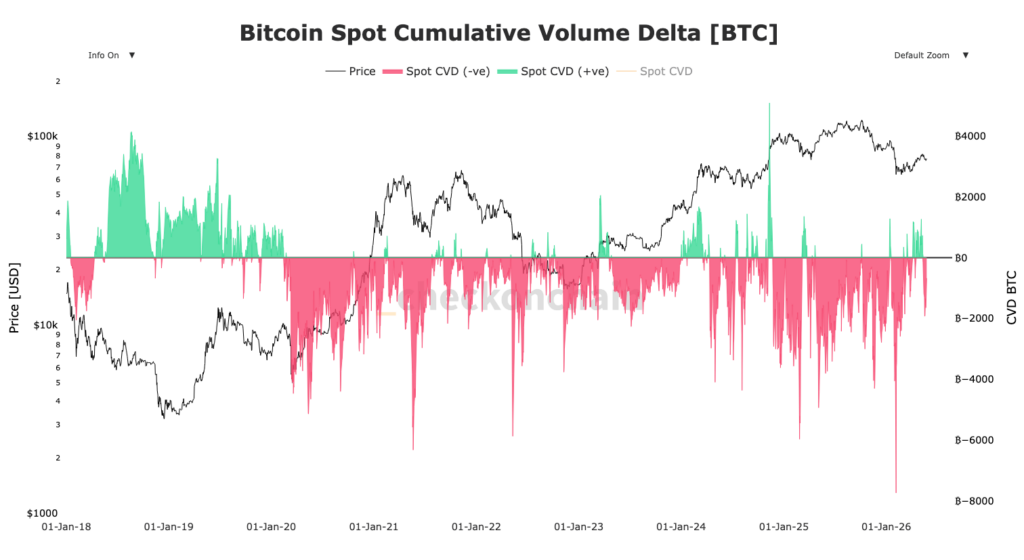
The cumulative volume delta (CVD) on Bitcoin spot order books remained negative for nine consecutive sessions until May 19, the longest period of sustained net selling in 2026 — confirming that the pressure did not solely come from ETFs, but also from the broader spot market. It will therefore be necessary to remain cautious on longs as BTC could still find a slightly lower bottom in the coming weeks.
In parallel, the Solana, XRP and Hyperliquid ETFs recorded net inflows of $15.63 million, $22.04 million and $72.38 million respectively. Institutional capital is not exiting the crypto market — it is repositioning, seeking yield in assets with higher short term beta. Generally, this premature rotation toward high beta assets heralds fleeting rallies that ultimately fail. Something to keep an eye on.
Sources:
Related Articles:

