Bitcoin Flashes Bullish Signal : Is the Next Leg of the Rally Starting Now ?
After a tumultuous 2024, Bitcoin appears to be gaining momentum again, with technical indicators now signaling a confirmed bullish trend.


After a tumultuous 2024, Bitcoin appears to be gaining momentum again, with technical indicators now signaling a confirmed bullish trend.
In the short term (1-hour chart), Bitcoin is currently trading in a consolidation zone below the symbolic $95,000 mark. The candles show market hesitation, with several doji and small red candles indicating increasing uncertainty among investors.
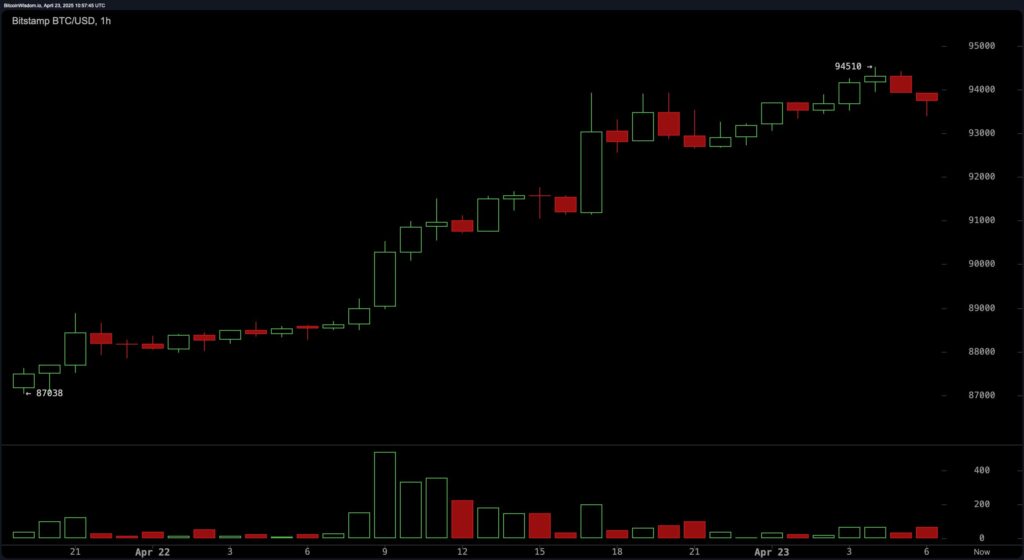
The decrease in trading volumes confirms a slowdown in buying momentum, suggesting potential challenges in surpassing this key level. Buyers might consider strategic entries around intermediate support levels between $92,500 and $93,000. However, a sustained drop below $93,000 would likely lead to a shift towards a bearish sentiment.
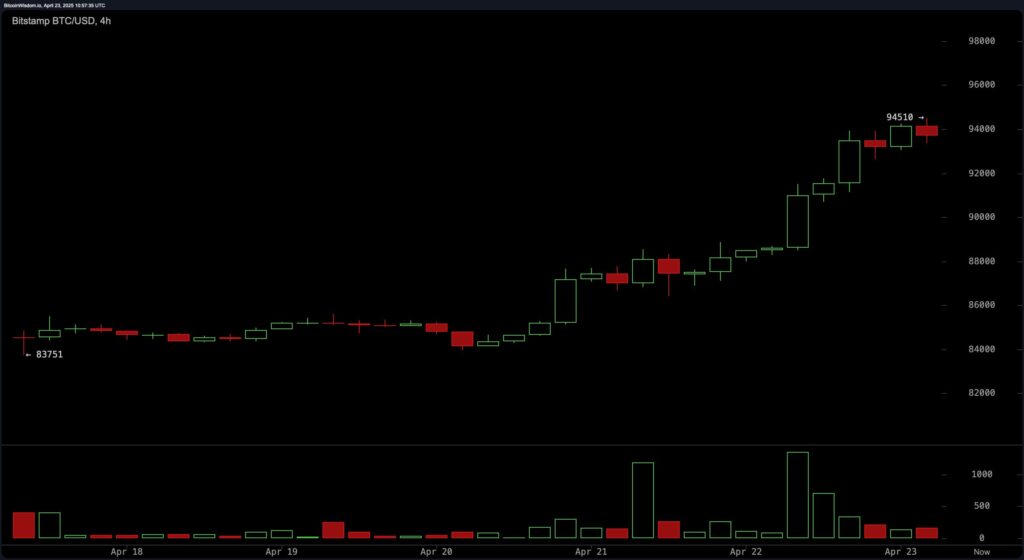
Expanding the analysis to the 4-hour chart, Bitcoin displays a well-defined bullish trend. The technical structure of higher highs and higher lows indicates a healthy and bullish market. However, a significant volume spike near $94,000 suggests profit-taking by major investors, potentially leading to a temporary consolidation phase.
Considering purchases around $91,000 to $92,000 seems appealing, with realistic targets set at $96,000 and then $98,000. Caution is advised as certain candles indicate potential short-term bearish reversals.
On a daily timeframe, Bitcoin has just confirmed a strong buying signal after finding solid support around $74,434. The clear surge beyond $90,000, supported by strong volume, validates the current market optimism.
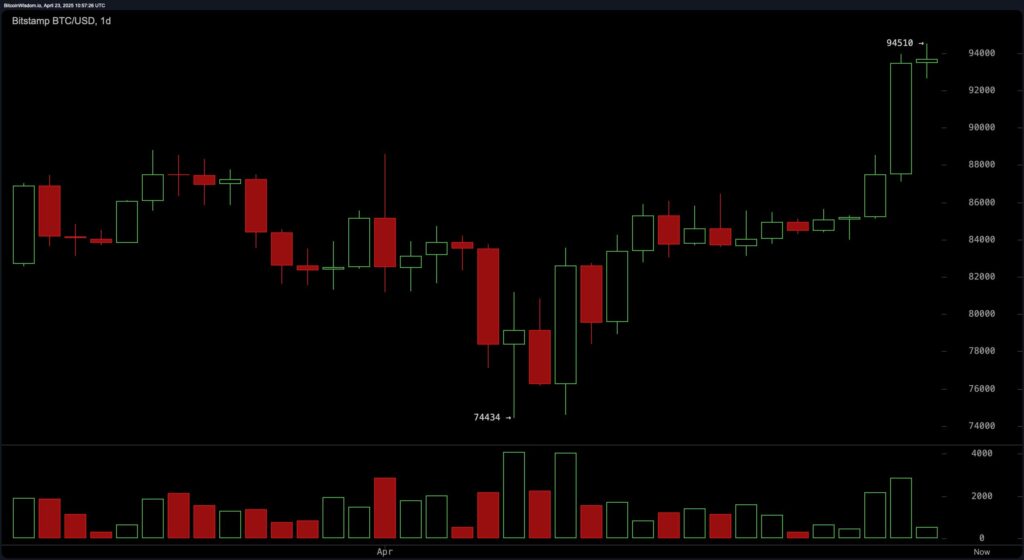
The missed ideal opportunities around $85,000 to $86,000 now redirect focus towards the key resistance at $95,000. At this psychological level, partial profit-taking might be wise while safeguarding positions with a cautious stop-loss near $88,000.
Technical indicators show mixed signals, albeit mostly bullish. The RSI at 68 and high stochastic at 95 indicate an approaching overbought zone. Despite signs of a potential pause or technical correction, the MACD and momentum indicator remain clearly bullish, supporting the bullish thesis. This contrast suggests adopting a balanced and cautious strategy.
The primary moving averages (EMA and SMA on various periods) all continue to trend upwards, confirming a solid positive momentum. This establishes a technical safety net below current levels, indicating that any corrections could present new medium-term buying opportunities.
The current trend of Bitcoin remains generally bullish, but traders should watch out for short-term exhaustion signals. By closely monitoring the mentioned key levels, they can adjust their strategies accordingly to maximize opportunities while mitigating risks.

Gaston has been a writer for over 7 years and a passionate cryptocurrency enthusiast since 2020. He loves exploring the crypto ecosystem and is now dedicated to sharing his insights and discoveries through InvestX.
DISCLAIMER
This article is for informational purposes only and should not be considered as investment advice. Trading cryptocurrencies involves risks, and it is important not to invest more than you can afford to lose.
InvestX is not responsible for the quality of the products or services presented on this page and cannot be held liable, directly or indirectly, for any damage or loss caused by the use of any product or service featured in this article. Investments in crypto assets are inherently risky; readers should conduct their own research before taking any action and invest only within their financial means. This article does not constitute investment advice.


Risk Warning : Trading financial instruments and/or cryptocurrencies carries a high level of risk, including the possibility of losing all or part of your investment. It may not be suitable for all investors. Cryptocurrency prices are highly volatile and can be influenced by external factors such as financial, regulatory, or political events. Margin trading increases financial risks.
CFDs (Contracts for Difference) are complex instruments with a high risk of rapid capital loss due to leverage. Between 74% and 89% of retail investor accounts lose money when trading CFDs. You should assess whether you understand how CFDs work and whether you can afford to take the high risk of losing your money.
Before engaging in financial or cryptocurrency trading, you must be fully informed about the associated risks and fees, carefully evaluate your investment objectives, level of experience, and risk tolerance, and seek professional advice if needed. InvestX.fr and the InvestX application may provide general market commentary, which does not constitute investment advice and should not be interpreted as such. Please consult an independent financial advisor for any investment-related questions. InvestX.fr disclaims any liability for errors, misinvestments, inaccuracies, or omissions and does not guarantee the accuracy or completeness of the information, texts, graphics, links, or other materials provided.
Some of the partners featured on this site may not be regulated in your country. It is your responsibility to verify the compliance of these services with local regulations before using them.
