Bitcoin’s Rally Unstoppable : Could it Hit $100,000 This Week ?
Despite a challenging start to the year, Bitcoin is showing signs of renewed vigour. A major chart pattern is emerging on the daily chart, indicating a potential continuation of the rally towards $100,000 and beyond.
The cryptocurrency market is experiencing a resurgence this week. The Bitcoin (BTC), the central driver of the ecosystem, is attracting attention with a +12% increase over the past week.
In this bullish context, a specific technical configuration — a Harmonic “Cypher” pattern — is emerging on the daily chart of BTC. This signal could anticipate a continuation of the rally towards a symbolic level: $100,000… or even beyond.
A Harmonic pattern is a precise chart analysis tool based on Fibonacci retracement ratios. In this case, it’s a Cypher, usually interpreted as a continuation signal, despite its structure resembling a reversal.
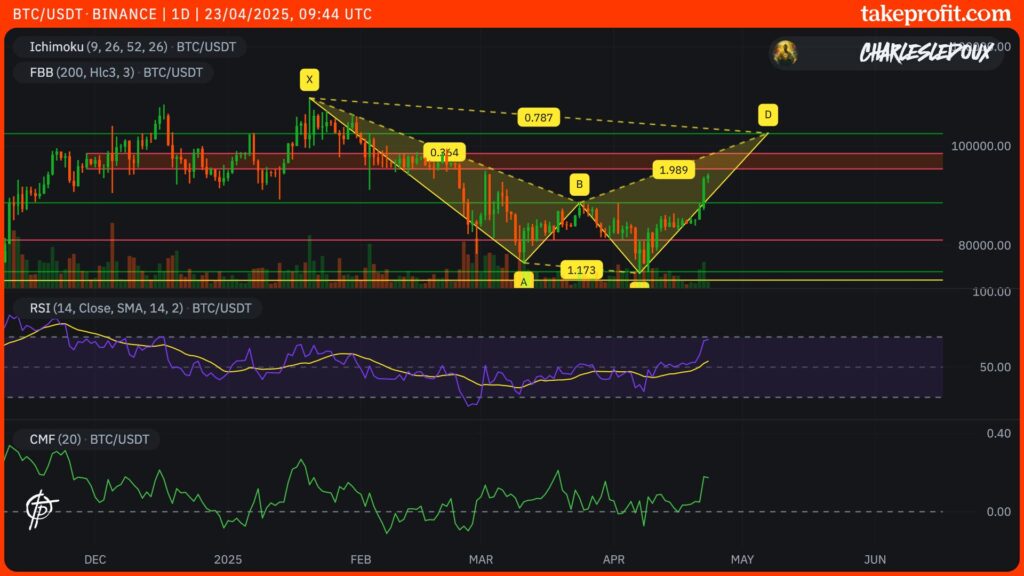
On the daily Heikin Ashi candlestick chart, the following configuration stands out:
Point X – Start of the pattern: Rejection at $109,557 (historical high on January 20, 2025)
Point A: Initial drop from the peak
Point B: Technical rebound
Point C: Significant correction, reaching around $74,522 on April 7
Point D: Theoretical target estimated at $102,546 (78.6% retracement of leg XC)
Despite a slight deviation on the Fibonacci extension (Point C < 1.27 ideally), the pattern remains valid, offering interesting short-term upside potential. Since Point C, BTC has already surged by over 25%, currently trading around $94,269.
Bitcoin (BTC) Targets
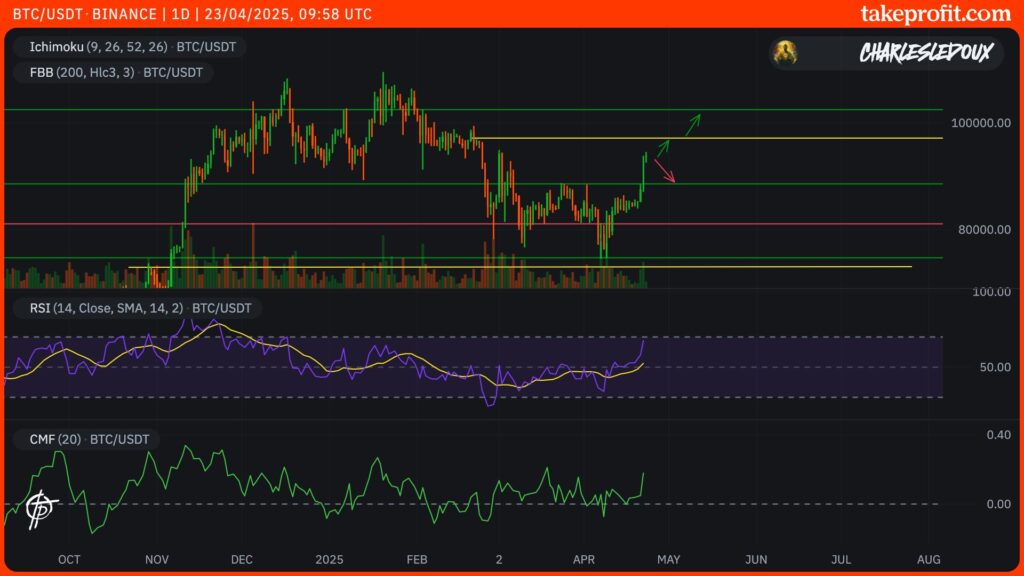
If the Cypher pattern confirms, the next major target to watch is Point D at $102,546. This would represent a nearly +9% increase from the current level. Before that, an intermediate hurdle stands at $97,043, corresponding to the 61.8% Fibonacci retracement of impulse XC — a critical zone monitored by short-term traders.
Additionally, this formation also displays a “W” pattern on Bitcoin, a pattern widely used by traders. As a result, many traders might take profits anticipating a retracement after this “W”.
Key levels to monitor:
🔸 Immediate Resistance: $97,043 (61.8% Fibonacci)
🔸 Major Resistance: $102,546 (78.6% Fibonacci)
🔸 Key Support: $74,500 (low of Point C of the pattern)
Although the indicators have not been detailed on the chart, several points confirm the current momentum:
RSI rising, confirming renewed buying interest
MACD crossing into positive territory (a precursor signal of a new uptrend)
Increasing volume, confirming the breakout above $94,000
The trend is still dominated by the bulls, supported by more stable macroeconomic fundamentals and reduced selling pressure post-halving.
What to Do ? Advice and Possible Scenarios
Institutional investors, often cautious around psychological levels (like $100,000), may take an active stance if the $97,000 resistance is breached with volume.
As long as the Harmonic pattern remains valid:
Aggressive traders could target the full extension at $102,546, while securing some profits around $97,000
Long-term investors could consider any correction towards $88,000 – $90,000 as a reloading opportunity
Prudent portfolio managers could wait for a clear breakout above $97,000 before adding to positions
🚨Bitcoin est devenu haussier à court terme, depuis le MSS (Market Structure Shift)📈
Le setup ressemble actuellement à une réaccumulation de Wyckoff, mais la demand des 73,000$ n'a pas été touchée❌
Ce qui perd des probabilités pour une continuation haussière durable selon moi… pic.twitter.com/gsQug5wbyJ
Analyst Zoral, however, warns of a potential distribution between $99,000 and $94,000. Indeed, Bitcoin has not retraced to the demand zone at $73,300. According to him, even though it “is not mandatory to return there,” there is a much lower probability of reaching new highs instead of making a new lower low below $74,400.
In conclusion, with this ongoing validation of the Harmonic Cypher pattern, Bitcoin seems well positioned to extend its bullish cycle. If intermediate resistances give way, the market could soon re-test (and potentially exceed) the historical milestone of $100,000.
A Harmonic structure is a powerful tool but offers no guarantees. Monitoring potential Bitcoin distribution in the coming days or weeks will be crucial.
Charles Ledoux is a Bitcoin and blockchain technology specialist. A graduate of the Crypto Academy, he has been a Bitcoin miner for over a year. He has written numerous masterclasses to educate newcomers to the industry and has authored over 2,000 articles on cryptocurrency. Now, he aims to share his passion for crypto through his articles for InvestX.
DISCLAIMER
This article is for informational purposes only and should not be considered as investment advice. Some of the partners featured on this site may not be regulated in your country. It is your responsibility to verify the compliance of these services with local regulations before using them.
DISCLAIMER
This article is for informational purposes only and should not be considered as investment advice. Trading cryptocurrencies involves risks, and it is important not to invest more than you can afford to lose.
InvestX is not responsible for the quality of the products or services presented on this page and cannot be held liable, directly or indirectly, for any damage or loss caused by the use of any product or service featured in this article. Investments in crypto assets are inherently risky; readers should conduct their own research before taking any action and invest only within their financial means. This article does not constitute investment advice.
Risk Warning : Trading financial instruments and/or cryptocurrencies carries a high level of risk, including the possibility of losing all or part of your investment. It may not be suitable for all investors. Cryptocurrency prices are highly volatile and can be influenced by external factors such as financial, regulatory, or political events. Margin trading increases financial risks.
CFDs (Contracts for Difference) are complex instruments with a high risk of rapid capital loss due to leverage. Between 74% and 89% of retail investor accounts lose money when trading CFDs. You should assess whether you understand how CFDs work and whether you can afford to take the high risk of losing your money.
Before engaging in financial or cryptocurrency trading, you must be fully informed about the associated risks and fees, carefully evaluate your investment objectives, level of experience, and risk tolerance, and seek professional advice if needed. InvestX.fr and the InvestX application may provide general market commentary, which does not constitute investment advice and should not be interpreted as such. Please consult an independent financial advisor for any investment-related questions. InvestX.fr disclaims any liability for errors, misinvestments, inaccuracies, or omissions and does not guarantee the accuracy or completeness of the information, texts, graphics, links, or other materials provided.
Some of the partners featured on this site may not be regulated in your country. It is your responsibility to verify the compliance of these services with local regulations before using them.
Get 6200 USDT with Bitget ! 🔥
Don't miss out on this offer !
Create your account now to unlock this exclusive reward