BNB faces potential 11% drop after $680 rejection
BNB is facing rejection at $680, potentially leading to an 11% drop. Get our technical analysis and key levels to watch for BNB price movement.


BNB is facing rejection at $680, potentially leading to an 11% drop. Get our technical analysis and key levels to watch for BNB price movement.
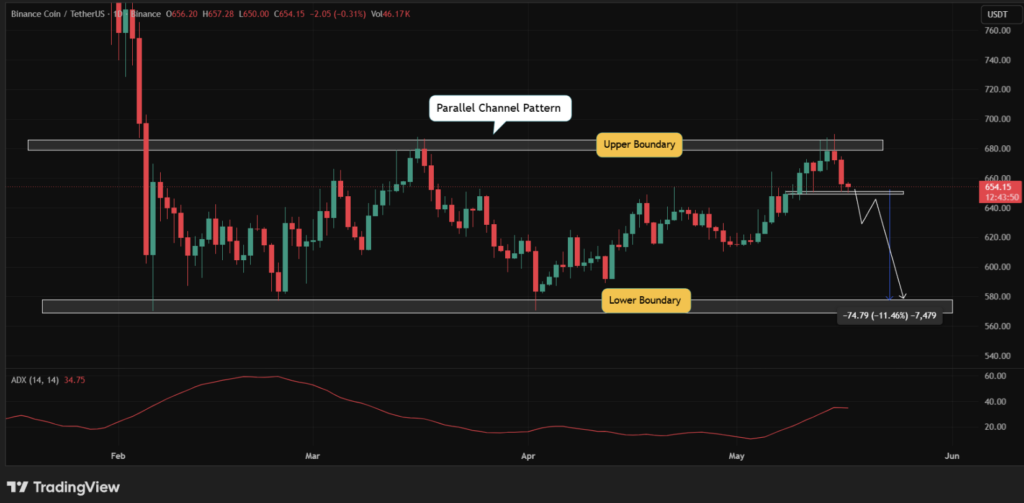
BNB has been hitting an impassable wall at $680 for several days. This support/resistance level has systematically rejected bullish breakout attempts. Each close below this zone strengthens seller conviction and weakens buyer momentum. The Binance token is thus beginning a bearish retracement, the amplitude of which will depend on the ability of bulls to defend lower levels. The current setup is precarious but not yet irreparably compromised.
All eyes are now converging on the critical $648 support. This level constitutes the last serious stronghold before a significant bearish acceleration. A daily close below this threshold would technically pave the way for increased selling pressure across the entire order book. The Bollinger Bands are squeezing around this level, a classic signal of an imminent market decision. The fear and greed index in neutral territory offers no clear bias for the moment.
The broader altcoins context does not favor a spontaneous bounce either. The persistent weakness of Bitcoin below $80,000 mechanically drags the entire market down. The crypto whales are not yet showing any massive accumulation signals at these levels on the Binance Smart Chain blockchain. The absence of a fundamental catalyst in the short term leaves technicals alone to dictate the direction. With the overall crypto trend leaning towards caution, every bounce remains suspect until volume confirmation.
Fibonacci levels identify the $640 to $648 zone as a 61.8% retracement of the last upward move. It is precisely this overlap between horizontal support and the Fibonacci level that gives this zone a particular structural solidity. The open interest on BNB futures remains high, maintaining pressure on both sides of the market. Traders engaged in scalping exploit this tension for short entries around intermediate resistances. Risk management becomes a priority in this binary setup.
The BNB technical analysis places $648 as the absolute decision pivot. The RSI is heading towards the oversold zone on the daily timeframe without having entered it yet, leaving room for further deterioration. The MACD shows a confirmed bearish crossover on intermediate timeframes. These two indicators combined lean in favor of sellers as long as the price remains below $680. An upward reversal of the MACD from these levels would constitute the first credible technical stabilization signal.
If selling volume intensifies below $648, the drop towards $578 could be rapid and brutal. This $578 area corresponds to a major liquidity zone where buy orders from investors who missed the last rally are accumulating. Elliott waves suggest that a fifth corrective wave is possible before a sustainable reversal. The CVD (Cumulative Volume Delta) will be decisive in confirming whether sellers truly dominate the net flows. Without a bullish divergence on this indicator, the bearish scenario remains favored.
Despite the technical correction, the fundamentals of the Binance Smart Chain ecosystem remain solid. Transaction volumes in DeFi and smart contracts on the BNB Chain network maintain a sustained level of activity. The quarterly burn mechanisms continue to reduce the circulating supply in a deflationary manner. This structural dynamic creates a fundamental floor that is difficult for medium term investors to ignore. The BNB fundamental analysis therefore justifies a bullish conviction over horizons exceeding 3 months.
BNB staking and the yields generated by the Binance ecosystem represent a permanent attraction for large capital. Institutional investors accessing cryptocurrencies through regulated platforms like Coinbase or OKX integrate BNB into their diversified allocations. The depth of liquidity available on Binance facilitates entries and exits for large positions without excessive slippage. This liquidity differential compared to other altcoins is a structural competitive advantage. It explains why BNB systematically features in diversified institutional portfolios.
The development of RWA and AI crypto on BNB Chain opens new growth vectors. These institutional narratives attract capital that goes beyond the simple speculative cycle. The current correction does not challenge this fundamental long term trajectory. For investors wishing to invest in crypto on BNB, this phase of weakness represents a strategic accumulation opportunity. The BNB price prediction for Q3 2026 remains positive for those who accept short term volatility.
Two scenarios clash with equal credibility. In the bullish setup, a convincing defense of $648 with increasing volume would trigger a bounce towards the $680 resistance. Crossing this level with confirmed momentum would reopen the road to new yearly highs. The 2025 crypto bull run retains its chances if Bitcoin resumes its upward march. The resilience of BNB at this level would be a classic buy signal in swing trading. The next 48 to 72 hours will be decisive in validating or invalidating this thesis.
The bearish scenario remains just as plausible. A break below $648 with significant selling volume would expose BNB to an 11.5% drop towards $578. This $578 zone constitutes the next major liquidity floor where structural buyers could intervene massively. A short duration bear market on BNB is not excluded if macro weakness persists. In this case, cascading liquidations on leverage positions would mechanically aggravate the fall.
The most prudent strategy is to split entries across two distinct levels. A first partial buy in the $648 to $655 zone allows capturing a potential bounce without full exposure. A second tier around $578 to $590 would constitute a more aggressive entry point if the breakdown materializes. Keeping positions in a secure wallet via Ledger remains essential for long term holders. Following BNB price predictions and on chain data will allow adjusting these levels in real time.
Sources:
Related Articles:

Crypto analyst with over 7 years of trading experience and a strong background in the iGaming and cryptocurrency industries, I cover crypto news with a rigorous yet accessible approach. Passionate about blockchain since 2019, I have published more than 1,200 articles and guides on cryptocurrencies, DeFi, and blockchain, recognized for their reliability and clarity.
Specializing in on-chain trading and whale activity analysis, I decode blockchain flows to anticipate market trends before they become obvious.
One of my articles was cited by Éric Larchevêque, co-founder of Ledger, highlighting the quality and credibility of my analysis.
My goal remains unchanged: to make crypto accessible and understandable for everyone, from beginners to experienced investors.
Follow me on LinkedIn and X to stay updated with my latest insights.
DISCLAIMER
This article is for informational purposes only and should not be considered as investment advice. Trading cryptocurrencies involves risks, and it is important not to invest more than you can afford to lose.
InvestX is not responsible for the quality of the products or services presented on this page and cannot be held liable, directly or indirectly, for any damage or loss caused by the use of any product or service featured in this article. Investments in crypto assets are inherently risky; readers should conduct their own research before taking any action and invest only within their financial means. This article does not constitute investment advice.


Risk Warning : Trading financial instruments and/or cryptocurrencies carries a high level of risk, including the possibility of losing all or part of your investment. It may not be suitable for all investors. Cryptocurrency prices are highly volatile and can be influenced by external factors such as financial, regulatory, or political events. Margin trading increases financial risks.
CFDs (Contracts for Difference) are complex instruments with a high risk of rapid capital loss due to leverage. Between 74% and 89% of retail investor accounts lose money when trading CFDs. You should assess whether you understand how CFDs work and whether you can afford to take the high risk of losing your money.
Before engaging in financial or cryptocurrency trading, you must be fully informed about the associated risks and fees, carefully evaluate your investment objectives, level of experience, and risk tolerance, and seek professional advice if needed. InvestX.fr and the InvestX application may provide general market commentary, which does not constitute investment advice and should not be interpreted as such. Please consult an independent financial advisor for any investment-related questions. InvestX.fr disclaims any liability for errors, misinvestments, inaccuracies, or omissions and does not guarantee the accuracy or completeness of the information, texts, graphics, links, or other materials provided.
Some of the partners featured on this site may not be regulated in your country. It is your responsibility to verify the compliance of these services with local regulations before using them.
