Chainlink (LINK) price analysis: Is a massive breakout imminent?
Chainlink (LINK) is showing signs of a potential breakout! Explore our analysis, key price levels, and scenarios for LINK's future.


Chainlink (LINK) is showing signs of a potential breakout! Explore our analysis, key price levels, and scenarios for LINK's future.
Currently trading around $9.23, LINK is down more than 1.13% over the last 24 hours. This movement is accompanied by a significant 10.5% jump in its trading volume, surpassing $310 million. This dynamic occurs in an overall uncertain market, where Chainlink stands out by trading between two very tight 9-hour order blocks.
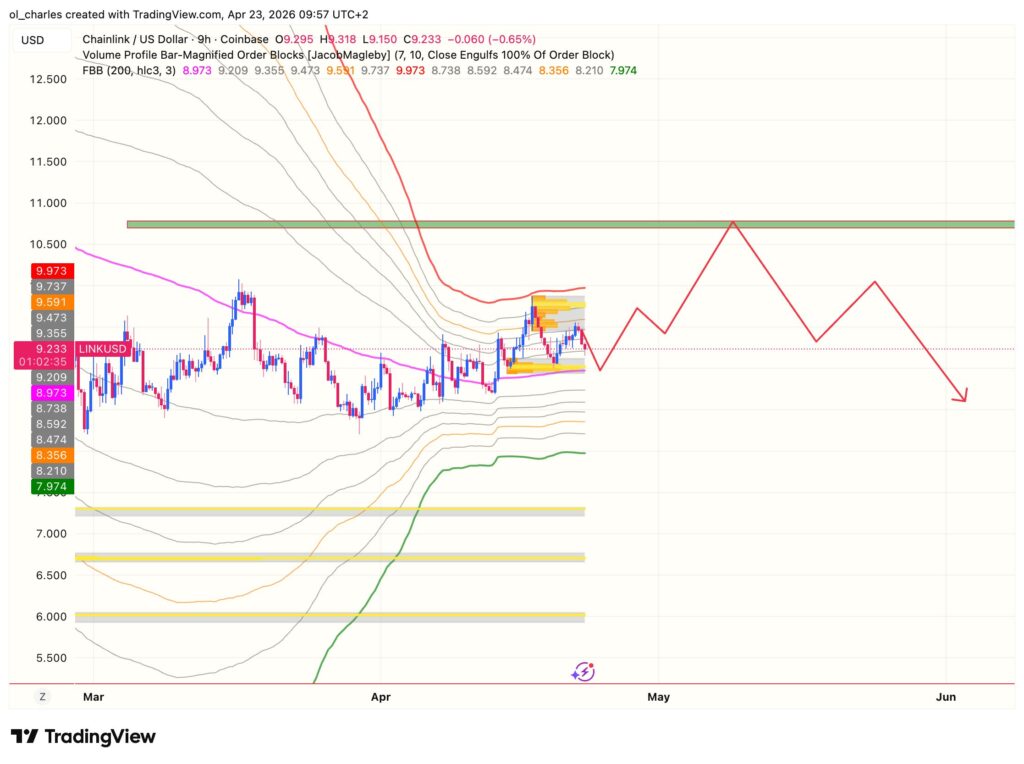
From a technical standpoint, the oracle token is forming a symmetrical triangle, a classic chart pattern that often precedes a major breakout. Furthermore, the Bollinger Bands have narrowed, which typically precedes strong market moves. The price is currently compressing between a solid support located in the $9 zone, and a stubborn liquidity resistance around $9.80. However, volatility is decreasing, signaling that an imminent breakout is brewing.
Momentum indicators, such as the RSI and the MACD, suggest that investors are taking fewer risks and starting to take profits at the top of the range. Breaking the $10 mark is essential. However, the $10.30 to $10.60 zone is an area where a fakeout could occur. Indeed, this represents the middle of the weekly Bollinger Bands and the final resistance zone before a potential surge toward $13.80.
If the bulls manage to propel the price above $10.10 with confirming volume, the bullish scenario will fully materialize. Such a breakout would pave the way for a rapid upward acceleration, with price targets set between $10.30 and $10.80. This rally could attract fresh capital and reignite enthusiasm around the Chainlink ecosystem, bringing it closer to its previous highs.
Conversely, a rejection at this resistance zone would validate a bearish scenario. If LINK fails to break through $10, a correction toward the bottom of the triangle is highly likely. The price could then suffer a severe retracement, returning to test its key support around $8.50, or even sliding down to $8.10 in the event of a broader market sell-off.
In the short term, the upside is favored as a cluster of shorts is located precisely between $10 and $10.40. This is why a rejection from this zone followed by a drop back below $10 would confirm a liquidity hunt and a fakeout.
The current price compression of Chainlink indicates that a strong directional move is about to occur. Traders are closely monitoring the daily close: a confirmed breakout above $10 could mark the beginning of a new bull run for the asset, while a failure could trap early buyers in a fakeout.
While accumulation signals are multiplying, the viability of this uptrend will depend on the market’s ability to sustain these levels with genuine institutional and retail volume. Since the crypto market is unpredictable, risk management remains paramount before taking a position on this type of technical setup.
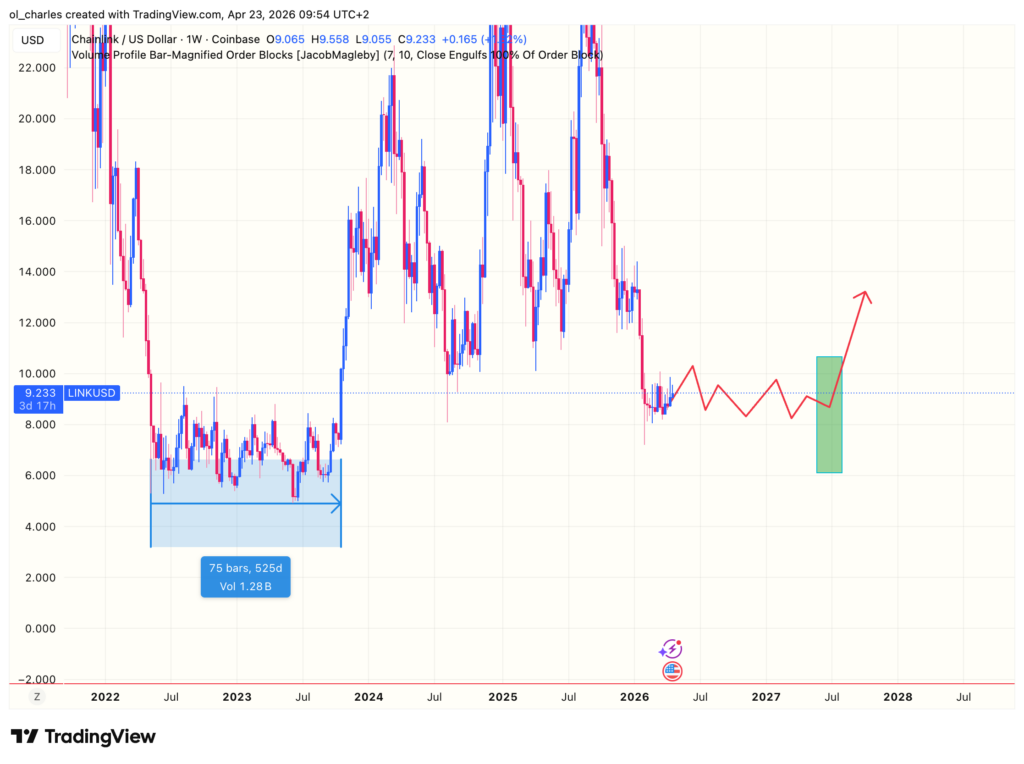
To conclude, it is worth remembering that LINK spent months in consolidation before experiencing its last breakout. Furthermore, the weakness of LINK’s rally despite Bitcoin returning near $80,000 suggests that buyers are still far too timid.
If LINK repeats its price action from the last bear market, it might not see its true breakout until the summer of 2027.
Nevertheless, LINK has proven its ability to outperform during recovery phases in the past. Is this the right time to accumulate before a potential surge to new highs, or does the market have one final bearish shakeout in store for us? LINK’s compression could be an indicator of an imminent strong move. For now, it is a waiting game to see which order block will be broken in the coming weeks.
Sources:
Related Articles:

Charles Ledoux is a Bitcoin and blockchain technology specialist. A graduate of the Crypto Academy, he has been a Bitcoin miner for over a year. He has written numerous masterclasses to educate newcomers to the industry and has authored over 2,000 articles on cryptocurrency. Now, he aims to share his passion for crypto through his articles for InvestX.
DISCLAIMER
This article is for informational purposes only and should not be considered as investment advice. Trading cryptocurrencies involves risks, and it is important not to invest more than you can afford to lose.
InvestX is not responsible for the quality of the products or services presented on this page and cannot be held liable, directly or indirectly, for any damage or loss caused by the use of any product or service featured in this article. Investments in crypto assets are inherently risky; readers should conduct their own research before taking any action and invest only within their financial means. This article does not constitute investment advice.


Risk Warning : Trading financial instruments and/or cryptocurrencies carries a high level of risk, including the possibility of losing all or part of your investment. It may not be suitable for all investors. Cryptocurrency prices are highly volatile and can be influenced by external factors such as financial, regulatory, or political events. Margin trading increases financial risks.
CFDs (Contracts for Difference) are complex instruments with a high risk of rapid capital loss due to leverage. Between 74% and 89% of retail investor accounts lose money when trading CFDs. You should assess whether you understand how CFDs work and whether you can afford to take the high risk of losing your money.
Before engaging in financial or cryptocurrency trading, you must be fully informed about the associated risks and fees, carefully evaluate your investment objectives, level of experience, and risk tolerance, and seek professional advice if needed. InvestX.fr and the InvestX application may provide general market commentary, which does not constitute investment advice and should not be interpreted as such. Please consult an independent financial advisor for any investment-related questions. InvestX.fr disclaims any liability for errors, misinvestments, inaccuracies, or omissions and does not guarantee the accuracy or completeness of the information, texts, graphics, links, or other materials provided.
Some of the partners featured on this site may not be regulated in your country. It is your responsibility to verify the compliance of these services with local regulations before using them.
