

Can LINK Target $50?
The cryptocurrency market is currently experiencing a contagious euphoria, driven by Bitcoin’s meteoric rise to new all-time highs. In this electrifying context, Chainlink (LINK) is emerging as one of the most promising altcoins, displaying remarkable technical resilience that is whetting the appetite of both institutional and retail investors. After weeks of lethargic consolidation under bearish pressure, LINK has just initiated an explosive rebound that could well mark the long-awaited inflection point.
The current momentum of the decentralized oracle project demonstrates a gradual accumulation by strong hands, while on-chain activity signals a tangible resurgence of interest. The decisive breakthrough of the psychological $23 barrier in early trading has electrified the crypto community, rekindling hopes of performances worthy of the 2021 altseason.
But beyond the ambient enthusiasm, what are the technical and fundamental catalysts that could propel LINK toward the coveted $50 zone?
Technical Analysis: The Cup and Handle Pattern That Could Save LINK
Chart analysis of LINK reveals a particularly bullish graphic configuration: the famous “cup and handle” pattern, considered by technical analysts as one of the most reliable bullish continuation patterns. This formation, materialized after several weeks of lateral accumulation, is characterized by a phase of gradual distribution followed by a moderate pullback forming the “handle” before exploding beyond the neckline.
The recent breakout above the consolidation range around $22.5 constitutes the first tangible signal of a momentum shift. The local resistance at $22.95 was authoritatively shattered, allowing bulls to regain control of the price action above the previously liquidated bullish trendline at $23.
The Bollinger Bands, after a characteristic compression of a low volatility period, are now entering an expansion phase that typically foreshadows a significant acceleration of volatility in the direction of the breakout.
However, a shadow remains in the picture: The trading volume remains below historical averages, raising legitimate questions about the real conviction of buyers and the sustainability of this upward movement.
Key Levels to Watch for Validating the Bullish Scenario
LINK’s technical roadmap outlines several critical zones that will determine its trajectory.
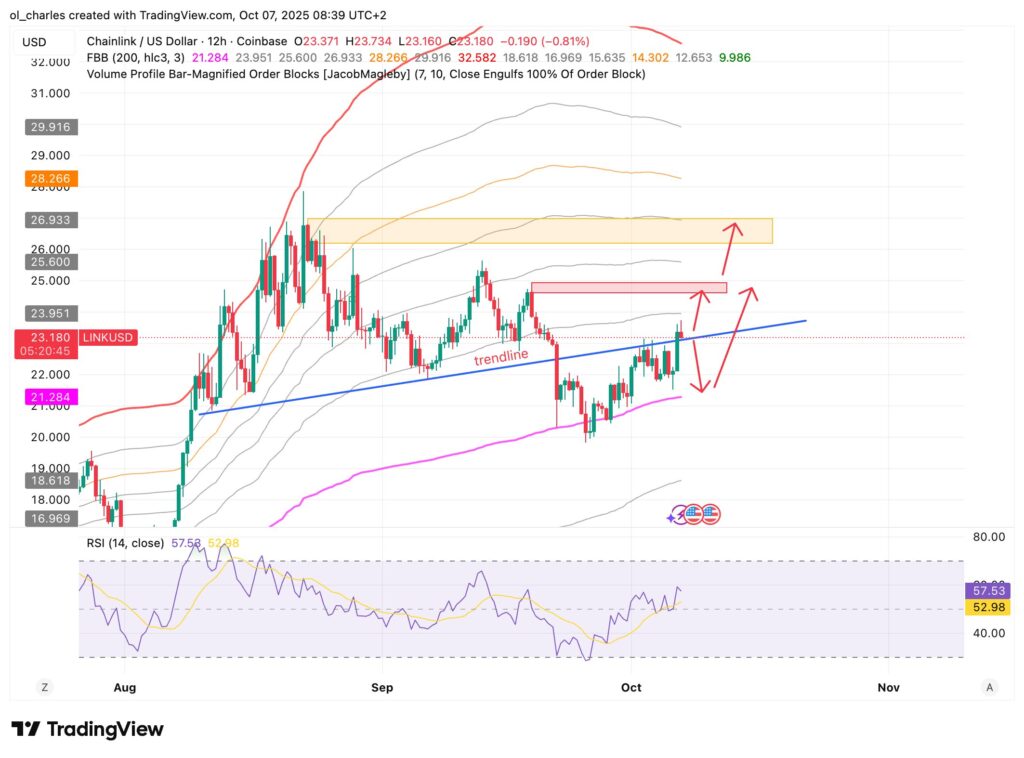
For a bullish scenario, the token must:
- Maintain above $23
- Decisively break through $25 and $27 with volume
Conversely, if its price falls below the trendline at $23, this clearly invalidates the breakout. A return to $21 would then be likely. However, this remains a short-term correction and a “false breakout” rather than the beginning of a deeper bearish trend.
How to Seize This Opportunity
With major support at $21, a correction would offer an optimal entry point on LINK. Meanwhile, a breakout above $25 could trigger a bullish rally to $50. Here’s how to buy it:
- Sign up: Create a Bitget account with email or mobile, and complete KYC for full access to AI tools.
- Deposit funds: Transfer USDT via credit card, SEPA transfer, or external wallet for immediate liquidity.
- Activate Get Agent: In the Bitget app, open “AI Tools,” launch Get Agent and target LINK/USDT. The AI will evaluate the cup and handle pattern and suggest entry points aligned with the $25 level.
- Trade LINK/USDT: Choose Spot for direct purchase or Futures for moderate leverage. Follow Get Agent for market or limit orders.
On the same subject:

