

Cascade Liquidations and Market Psychology Under Pressure
The day was marked by massive liquidations primarily affecting leveraged long positions on Bitcoin. More than $612 million was wiped out across trading platforms, with approximately $502 million concerning traders positioned bullish. These figures reflect significant overleverage in a context of heightened volatility.
Bitcoin’s Open Interest across all centralized exchanges reached its lowest level in seven months, signaling notable disengagement from both institutional and retail investors.
However, the OI climbed during the drop. It was in this context that a rapid fall to $100,800 this morning following the announcement of government reopening caught traders off guard before bouncing massively to $103,750 at the time of writing.
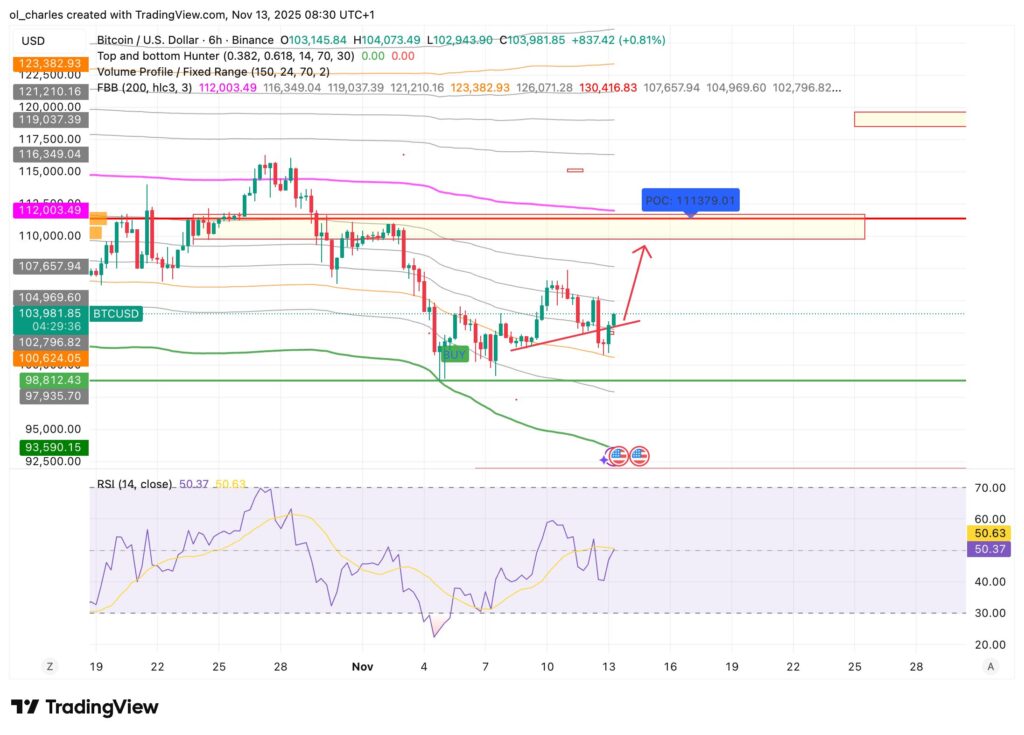
This type of pattern and stop loss hunting signals a Bitcoin rebound in the coming hours. A break above $105,300 would almost guarantee a move toward $109-110,000 in the next few days. This is the resistance to monitor today.
The volatility phenomenon amplified with rumors circulating around Hyperliquid, the largest decentralized futures trading platform. Fears of a potential attack triggered a panic movement, pushing many traders to prematurely close their positions to limit their exposure.
The Paradox of US Government Reopening
The reopening of the US government after more than a month of shutdown should have logically instilled optimism in financial markets. However, the crypto market recorded the opposite effect with a particularly marked “sell the news” phenomenon. Long traders therefore bore the brunt of this sell-off.
Nevertheless, while Bitcoin lost ground, gold gained 2% to reach approximately $4,200 per ounce. This divergence illustrates sectoral rotation where investors temporarily favor traditional safe-haven assets. Capital outflows from Bitcoin and Ethereum ETFs confirm this trend, with structural demand declining for several weeks.
Is the 2025 Bull Run Back?
Despite this bullish short-term outlook, Bitcoin still cannot decisively break through its critical levels. Every rally is truncated by rapid drops. The MVRV chart of Bitcoin ETFs indicates that Bitcoin is far from undervalued, but rather in an overvalued phase, close to neutral.
The longer Bitcoin remains in this range, the more impatient investors will take profits. This is what we call “Time Capitulation”.
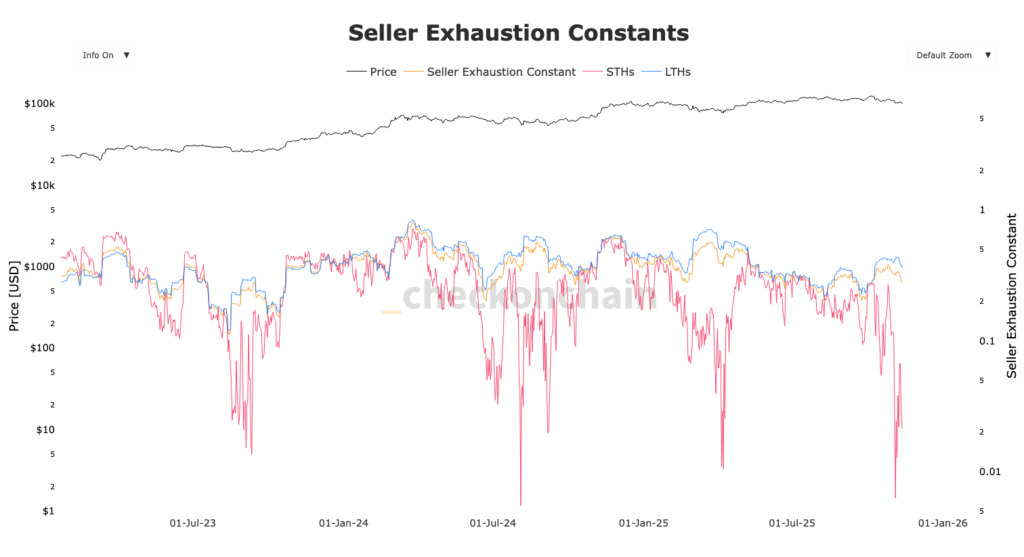
On the other hand, the “Seller Exhaustion” chart shows major capitulation from Short Term Holders. In most cases, these massive capitulations indicate that a bottom had been reached. The only times this wasn’t the case were during previous bear markets.
Gold price analysis reveals a possible macroeconomic double top formation. If this configuration confirms, it could mark a favorable turning point for Bitcoin and altcoins. Corrections of 15 to 25% remain normal in a crypto bull cycle and help clean up the market by eliminating excess speculation.
The coming weeks will be crucial to confirm or deny the continuation of the bull market. The psychological support of $100,000 for Bitcoin constitutes a crucial level to monitor to gauge the strength of institutional demand.
How to Position on Bitcoin?
While Bitcoin oscillates, the Pionex Grid Futures Bot proves to be a powerful strategy to capitalize on this volatility. This bot automatically places buy and sell orders within a defined range (e.g., $95,000-115,000), scalping upward and downward movements without directional bias, with potential returns of 30-180% annualized thanks to AI 2.0.
Related Topics:

