Hyperliquid (HYPE) Reclaims $20 : Is Jupiter (JUP) the Next to Rally ?
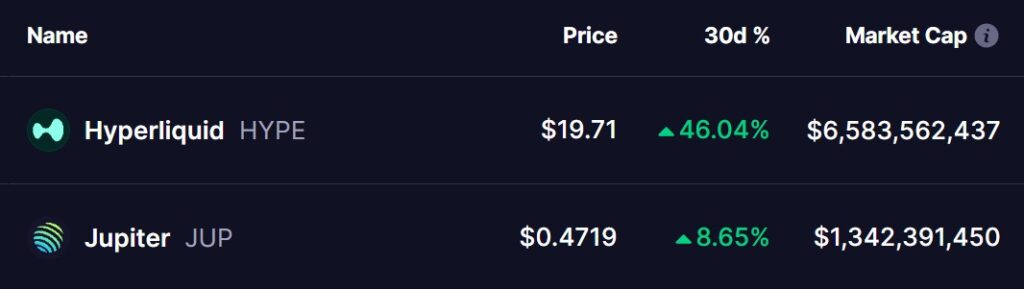
In the midst of recent crypto market movements, two tokens stand out: Hyperliquid (HYPE) and Jupiter (JUP). While HYPE has soared by an impressive 46% over the month, JUP is trying to follow suit, following a similar technical pattern.
After a sharp correction in Q1 2025, the crypto markets are beginning a gradual recovery. In this scenario, Hyperliquid (HYPE) stands out as a leader with a monthly increase of +46%, supported by major technical breakthroughs in the daily timeframe.
On the other hand, Jupiter (JUP), although showing a more modest growth of +8% in the last 30 days, its technical setup hints at a potential catch-up – possibly following a fractal pattern similar to HYPE.
Source: CoinMarketCap
Hyperliquid (HYPE) Leading the Way
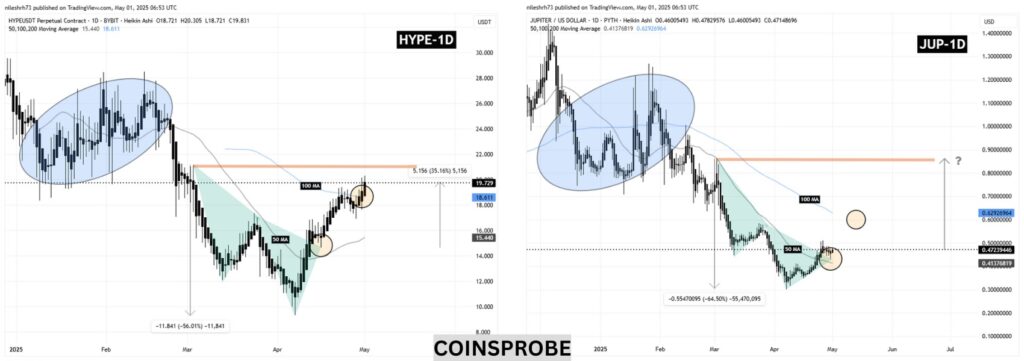
On the chart, Hyperliquid experienced a severe correction of 56% at the beginning of the year. This decline formed a “Bearish Cypher” harmonic pattern, often indicative of a trend reversal.
After hitting a low point at $9.34, HYPE started a marked recovery, breaking above its 50 and 100-day moving averages (MA50 and MA100). The current price hovers around $19.70, with a major resistance to overcome at $21.12.
Source: TradingView / Coinsprobe
Above this threshold, the next technical target would exceed $25.
The JUP token chart displays a strikingly similar configuration:
64% correction and formation of an almost identical harmonic pattern
Slow but structured recovery towards the MA50 (currently at $0.47)
Next technical resistance: MA100 around $0.62
If Jupiter strictly follows the same fractal as HYPE, analysts believe the token could target the next resistance zone around $0.86. This would represent an 81% upside potential from the current level.
Short-term goal: break through $0.62, approximately +25%.
For savvy crypto investors, HYPE and JUP present technical touchpoints to closely monitor. Fractal patterns, although powerful, always require validation through volumes and key moving averages behavior.
Conditions necessary for the continuation of the JUP uptrend:
Sustained break of the MA100 ($0.62)
Sustained buying volume
No clear rejection below historical resistances
A failure below these levels could lead to sideways consolidation or even a trend reversal.
Gaston has been a writer for over 7 years and a passionate cryptocurrency enthusiast since 2020. He loves exploring the crypto ecosystem and is now dedicated to sharing his insights and discoveries through InvestX.
DISCLAIMER
This article is for informational purposes only and should not be considered as investment advice. Some of the partners featured on this site may not be regulated in your country. It is your responsibility to verify the compliance of these services with local regulations before using them.
DISCLAIMER
This article is for informational purposes only and should not be considered as investment advice. Trading cryptocurrencies involves risks, and it is important not to invest more than you can afford to lose.
InvestX is not responsible for the quality of the products or services presented on this page and cannot be held liable, directly or indirectly, for any damage or loss caused by the use of any product or service featured in this article. Investments in crypto assets are inherently risky; readers should conduct their own research before taking any action and invest only within their financial means. This article does not constitute investment advice.
Risk Warning : Trading financial instruments and/or cryptocurrencies carries a high level of risk, including the possibility of losing all or part of your investment. It may not be suitable for all investors. Cryptocurrency prices are highly volatile and can be influenced by external factors such as financial, regulatory, or political events. Margin trading increases financial risks.
CFDs (Contracts for Difference) are complex instruments with a high risk of rapid capital loss due to leverage. Between 74% and 89% of retail investor accounts lose money when trading CFDs. You should assess whether you understand how CFDs work and whether you can afford to take the high risk of losing your money.
Before engaging in financial or cryptocurrency trading, you must be fully informed about the associated risks and fees, carefully evaluate your investment objectives, level of experience, and risk tolerance, and seek professional advice if needed. InvestX.fr and the InvestX application may provide general market commentary, which does not constitute investment advice and should not be interpreted as such. Please consult an independent financial advisor for any investment-related questions. InvestX.fr disclaims any liability for errors, misinvestments, inaccuracies, or omissions and does not guarantee the accuracy or completeness of the information, texts, graphics, links, or other materials provided.
Some of the partners featured on this site may not be regulated in your country. It is your responsibility to verify the compliance of these services with local regulations before using them.
Get 6200 USDT with Bitget ! 🔥
Don't miss out on this offer !
Create your account now to unlock this exclusive reward