

A historic bearish signal for BTC?
The financial market is holding its breath. On Monday, the price of WTI crude oil surged by 5.3% to approach $105 a barrel, a level unseen since 2022. Following suit, the Nasdaq closed down 0.75% and the S&P 500 dropped by 0.4%. Meanwhile, Bitcoin surrendered its morning gains to settle back around $66,500. For crypto traders, this figure brings back bad memories.
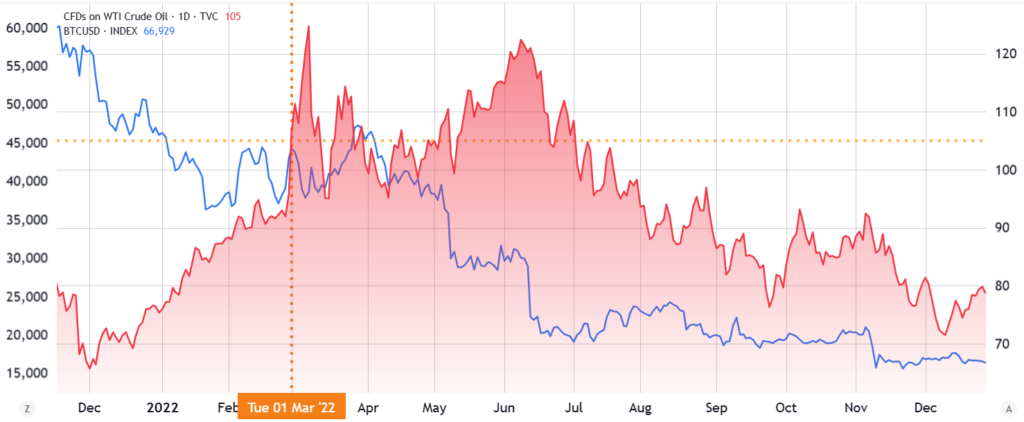
Historical data shows that the $105 WTI threshold has coincided with Bitcoin corrections ranging from 14% to 27% in the following weeks. In June 2014, following the advance of the Islamic State in Iraq, BTC suffered a 21% correction in less than ten weeks. In May 2022, following the European embargo on Russian oil, Bitcoin recorded a 27% crash in seven days. This plunged the asset into a bear market for 19 months before it finally reclaimed $39,700.
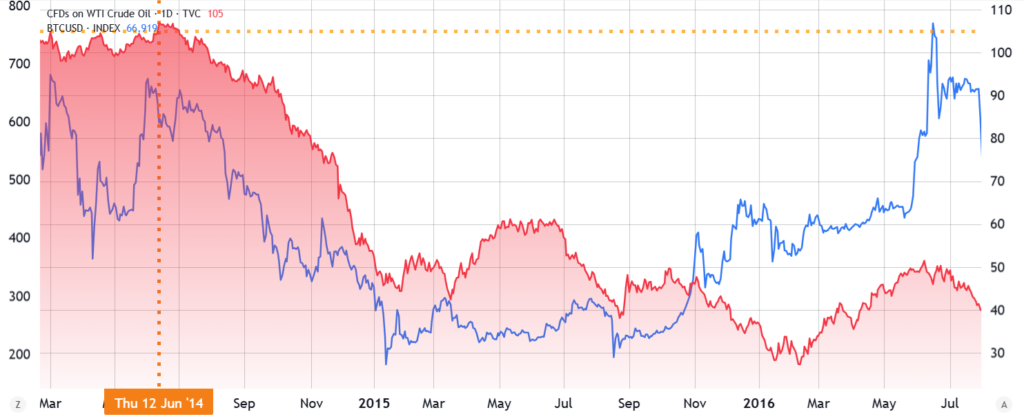
Today, the price of Bitcoin is fluctuating between $67,400 and $67,500. A similar 27% drop would drag the asset below the critical $50,000 mark. Technical indicators such as the RSI and MACD show buyer hesitation in the face of this macroeconomic pressure.
False correlation or real threat?
While oil at $105 is perceived as a bearish signal, three occurrences in twelve years are not enough to prove an absolute correlation. Other systemic factors played a much more devastating role during these downward cycles. The liquidation of the Mt. Gox platform in February 2014 and the implosion of the Terra-Luna ecosystem in May 2022 were likely the true catalysts for these prolonged bear markets.
The correlation between Bitcoin and tech stocks currently stands at 0.9, an extremely high level. For the digital gold narrative to take over, this correlation would need to drop below 0.5 over a 30 day period, signaling a structural decoupling. The critical threshold would be oil sustaining above $110. At this level, inflationary pressure could trigger a capital rotation toward safe haven assets, potentially including Bitcoin.
The Federal Reserve, however, provides a reassuring element. Jerome Powell stated that the central bank was looking past the short term oil shock linked to Iran, as inflation expectations remain well anchored. These comments have helped soothe the bond market.
How far can Bitcoin correct?
In a bearish scenario, data shows that when oil reached $120 a barrel in early March 2026, 94,058 traders were liquidated within 24 hours, resulting in total losses of $364.4 million. With traditional markets closed over the weekend, crypto was the only liquid asset available for panic selling. Selling volume surged by $1.8 billion in a single hour.
The $60,000 zone represents the first major safety net if the $65,000 support were to break. Conversely, a daily close above $69,000 would reignite the bullish momentum and pave the way for a return to the ATH. Trading volumes will be crucial in validating either direction.
What this really changes
The oil and Bitcoin correlation is not direct but indirect. When oil rises, it attracts speculators who turn away from Bitcoin and may even sell BTC to buy WTI futures contracts. This is an emotional and speculative correlation that manifests intermittently rather than systematically.
What truly matters is the macroeconomic transmission chain. High oil prices fuel inflation, which forces the Fed to maintain restrictive interest rates. This compresses liquidity and mechanically weighs on all risk assets. Jake Ostrovskis from Wintermute summarizes it bluntly: Brent crude sustaining above $80 makes Fed rate cuts impossible before mid 2026, which constitutes the real risk for altcoins and Bitcoin.
The historical correlation with the $105 threshold deserves attention without necessarily triggering panic. The market has repeatedly proven its resilience to oil shocks, provided that other systemic events like a new Mt. Gox or Terra-Luna do not amplify the movement. Monitoring chart patterns on the upcoming weekly closes remains the priority.
Sources:
- TradingView
- KobeissiLetter on X
- Cointelegraph on X
Related Articles:

