

Harmonic Pattern Suggests Bullish Potential
Solana, in particular, is showing promising signs of recovery. We have seen an increase of over 3% today and monthly gains reaching 18%. A detailed technical analysis reveals that SOL could still have short-term upside potential.

On the hourly chart, Solana is currently forming a bearish harmonic pattern known as a Cypher. This type of configuration is often used by traders to identify potential reversal zones, especially once the last leg, referred to as “CD,” is completed. Up to this point, prices tend to continue their upward trajectory, supported by bullish momentum.
The pattern began to form on May 23. SOL reached a short-term peak at $187.52, marked as point X, before experiencing a significant correction. The price dropped by over 9%, finding support near $169 on May 25, identified as point C.
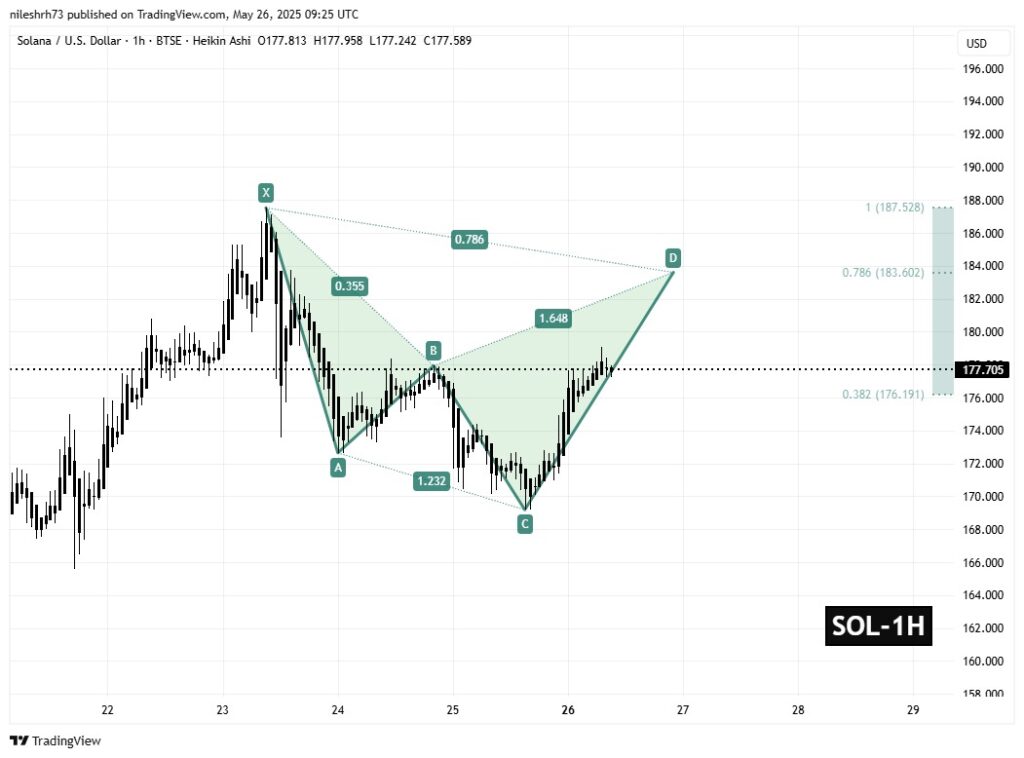
Since this low point, Solana has rebounded and is now forming the CD leg of the pattern. According to harmonic theory, if this pattern confirms, the price could move towards point D, around $183.60. This corresponds to a Fibonacci retracement of 78.6% from leg XC. Compared to current trading levels near $177.50, this suggests a potential upside of about 3.43%.
Future Outlook for Solana
The area around $183.60 will be a key level to monitor. Following the principles of harmonic trading, this zone often serves as a reversal area where sellers may re-enter the market. However, if Solana manages to surpass this threshold with strong volume and momentum, the rally could extend, targeting a full return to $187.52 – its recent high. This increase would represent a gain of about 5.60% from current prices.
Conversely, if SOL struggles to exceed the $183.60 level, it could indicate a weakening of the bullish momentum. In this case, the token may experience a consolidation phase or undergo some profit-taking before attempting a new upward move.
Either way, savvy investors will closely monitor Solana’s progress in the coming days, as current technical signals suggest interesting short-term upside potential.

