Toncoin (TON) plummets 15%: Where does the price go from here?
Toncoin (TON) experiences a sharp 15% correction. Explore our technical analysis, key support levels, and what this means for the future of TON.


Toncoin (TON) experiences a sharp 15% correction. Explore our technical analysis, key support levels, and what this means for the future of TON.
Toncoin has made an explosive move in recent weeks. The Telegram token reached a local top at $2.90 on May 7, propelled by a series of powerful fundamental catalysts. This rally took the market by surprise, liquidating nearly $29 million in short positions in just two days. The sheer force of the bullish movement made a correction all the more likely.
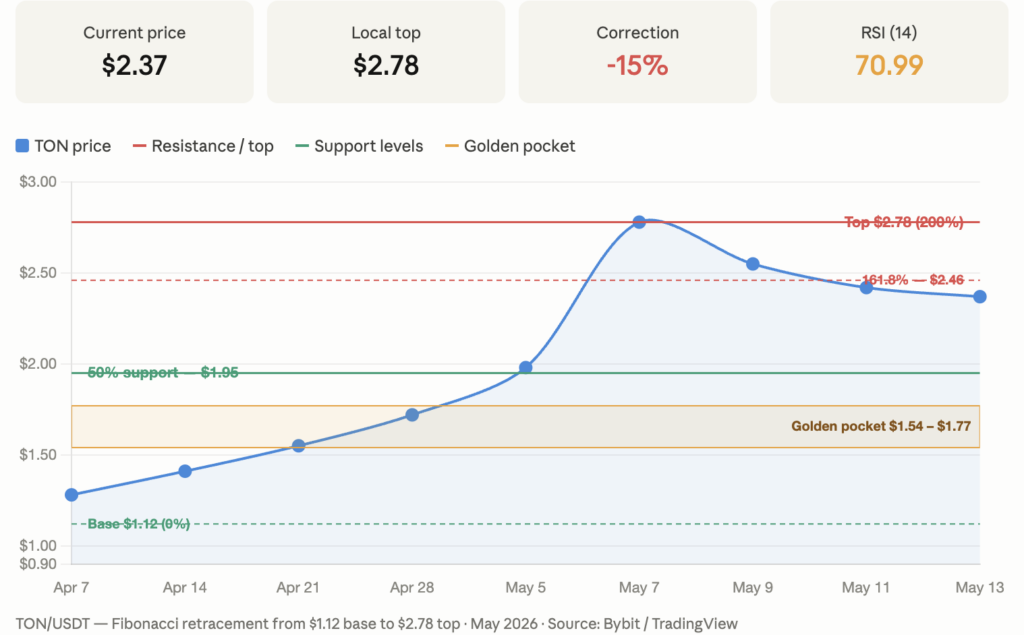
The reversal came quickly. TON is now trading between $2.30 and $2.35, representing a drop of over 15% from its peak. Selling pressure intensified after the price breached and then lost the 161.8% Fibonacci extension at $2.46. This level, often used as a profit taking zone by experienced traders, played its role as resistance to perfection.
The fundamentals, although solid, were not enough to contain the pressure. The network absorbed a massive token unlock of $103 million without collapsing, which demonstrates real resilience. Telegram was also confirmed as the main network validator replacing the TON Foundation. These positive elements remain in place, but the market is digesting the excess leverage accumulated during the rally.
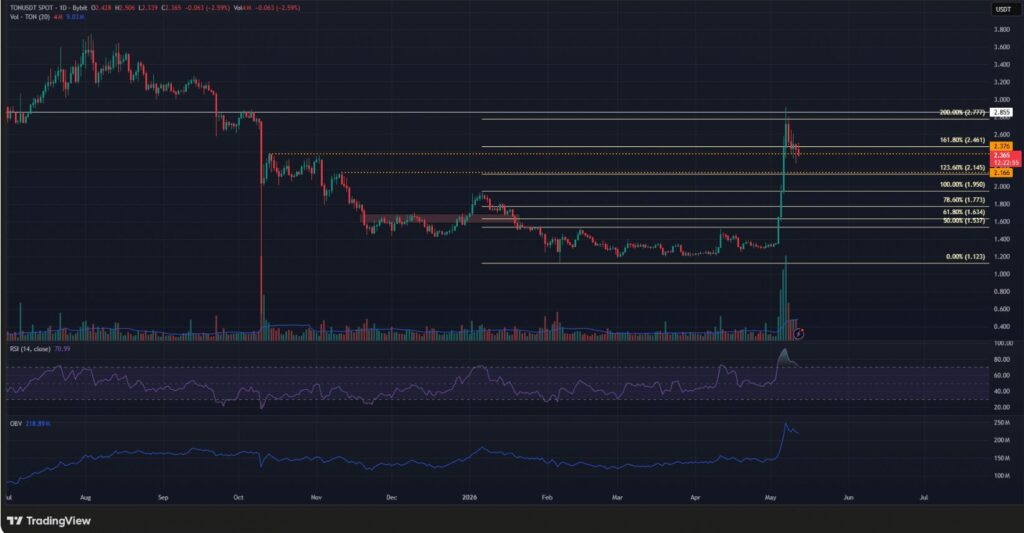
The technical analysis on TON sent clear warning signals before the reversal. The RSI had reached multi month levels in the extreme overbought zone, a classic signal of exhausted buying momentum. When the MACD begins to diverge negatively after such an excess, a correction becomes a matter of timing rather than probability. Traders following the Bollinger bands had also noted an extreme expansion of the bands, a usual precursor to mean reversion.
The macro context amplifies the bearish pressure. Bitcoin is oscillating around $80,000 in an ambiguous technical structure. If BTC confirms a bear market setup on higher timeframes, altcoins like TON will be the first to suffer the consequences. The correlation between Bitcoin and tier two cryptocurrencies remains very high during periods of macro uncertainty.
Trading volumes confirm this diagnosis. The slowdown in trading observed since the May 7 peak indicates that buyers have not yet returned in force. Without a volume recovery, any technical bounce remains fragile and suspect. Fans of day trading and scalping are currently navigating a minefield, with frequent fakeouts in this post peak consolidation phase.
The Fibonacci levels projected on the last bullish move define the map of supports to monitor. The first critical level sits at $2.01, corresponding to the 50% retracement. This is a major psychological defense zone for the bulls. A clean break of this support/resistance would open the door to much lower levels and structurally change the market bias on TON.
The bearish continuation scenario points toward the golden pocket, a zone between the 61.8% and 78.6% retracements, representing a range between $1.50 and $1.80. Reaching this level would represent a severe correction from the top, but it would also constitute a historically effective reload zone. Crypto whales often place their accumulation orders in these areas, as shown by on chain data available on specialized platforms.
For investors looking to invest in crypto on TON with a medium term logic, patience is the best strategy in this context. Waiting for a reversal confirmation on one of these supports, alongside a volume recovery and a positive MACD signal, significantly limits the risk of catching a falling knife.
Two scenarios are clashing regarding Toncoin forecasts. The bullish scenario relies on a surprise short squeeze. If short sellers accumulate too aggressively and the price bounces violently off a key support, a liquidation wave could propel TON toward the psychological resistance of $3.00. The open interest on futures contracts will be the decisive indicator to watch to validate this scenario.
The bearish scenario remains plausible if Bitcoin confirms a negative structure over the coming weeks. In this context, the bull run hoped for TON would be postponed. Bitcoin forecasts are therefore the first filter to apply before making any positioning decision on this asset. A BTC weekly close below $78,000 would significantly alter the risk calculation.
Our read: the market structure of TON remains bullish on higher timeframes, but the ongoing correction is real and potentially deep. The global fear and greed index reflects a nervousness that justifies caution. For long term HODL profiles, securing assets on a Ledger and waiting for the confirmation of a new cycle remains the most rational stance. The broader crypto trend will determine whether TON finds its floor at $2.01 or drops to test the golden pocket.
Sources:
Related Articles:

Crypto analyst with over 7 years of trading experience and a strong background in the iGaming and cryptocurrency industries, I cover crypto news with a rigorous yet accessible approach. Passionate about blockchain since 2019, I have published more than 1,200 articles and guides on cryptocurrencies, DeFi, and blockchain, recognized for their reliability and clarity.
Specializing in on-chain trading and whale activity analysis, I decode blockchain flows to anticipate market trends before they become obvious.
One of my articles was cited by Éric Larchevêque, co-founder of Ledger, highlighting the quality and credibility of my analysis.
My goal remains unchanged: to make crypto accessible and understandable for everyone, from beginners to experienced investors.
Follow me on LinkedIn and X to stay updated with my latest insights.
DISCLAIMER
This article is for informational purposes only and should not be considered as investment advice. Trading cryptocurrencies involves risks, and it is important not to invest more than you can afford to lose.
InvestX is not responsible for the quality of the products or services presented on this page and cannot be held liable, directly or indirectly, for any damage or loss caused by the use of any product or service featured in this article. Investments in crypto assets are inherently risky; readers should conduct their own research before taking any action and invest only within their financial means. This article does not constitute investment advice.


Risk Warning : Trading financial instruments and/or cryptocurrencies carries a high level of risk, including the possibility of losing all or part of your investment. It may not be suitable for all investors. Cryptocurrency prices are highly volatile and can be influenced by external factors such as financial, regulatory, or political events. Margin trading increases financial risks.
CFDs (Contracts for Difference) are complex instruments with a high risk of rapid capital loss due to leverage. Between 74% and 89% of retail investor accounts lose money when trading CFDs. You should assess whether you understand how CFDs work and whether you can afford to take the high risk of losing your money.
Before engaging in financial or cryptocurrency trading, you must be fully informed about the associated risks and fees, carefully evaluate your investment objectives, level of experience, and risk tolerance, and seek professional advice if needed. InvestX.fr and the InvestX application may provide general market commentary, which does not constitute investment advice and should not be interpreted as such. Please consult an independent financial advisor for any investment-related questions. InvestX.fr disclaims any liability for errors, misinvestments, inaccuracies, or omissions and does not guarantee the accuracy or completeness of the information, texts, graphics, links, or other materials provided.
Some of the partners featured on this site may not be regulated in your country. It is your responsibility to verify the compliance of these services with local regulations before using them.
