

Solana and TRON in the Top 5 Layer-1 Networks
The ranking of blockchains by daily active users in April 2026 reveals a radically different landscape than expected just six months ago. Ethereum is missing from the top 5. This is no accident; it signals a structural redistribution of on-chain activity across Layer-1 networks.
BNB Chain leads the race with over 4.3 million daily active users, followed by TRON with 3.2 million, NEAR Protocol with 2.5 million, Solana with 2.4 million, and SEI with 1.4 million.
BNB and TRON hold the top two spots for different yet complementary reasons. BNB Chain remained the most stable network during the week of March 30 to April 5, 2026, boasting consistent TVL and strong user activity, even as trading volumes continue to decline. TRON, on the other hand, owes most of its traffic to its role as payment rails for stablecoins, particularly USDT. These are two very distinct dynamics: one is driven by the DeFi ecosystem and dApps, while the other is fueled by sheer transactional volume.
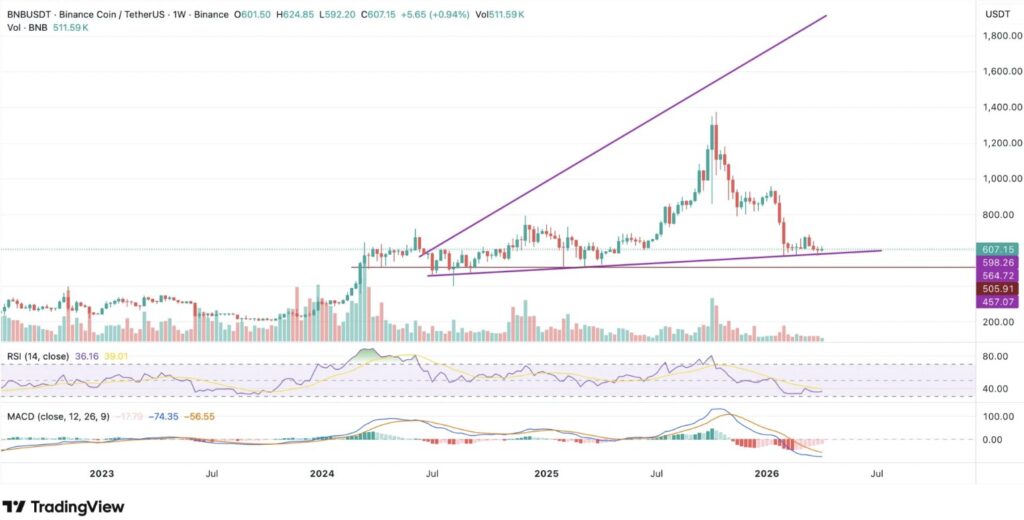
BNB is trading around $603, with TRX at $0.32. These price levels reflect a market that primarily values the stability of these networks over their short-term speculative potential. For investors looking to reduce their exposure to altcoin risk, this is a defensive setup rather than an offensive one.
The Solana Case: Record Adoption, Price Under Pressure
Solana amassed 2.4 million daily active users in April, but holder metrics tell a more nuanced story. The number of SOL holders reached an all-time high of 166.9 million in April 2026, marking a 12% increase since October. However, the Realized Cap dropped from $96.9 billion to $78.5 billion since October, representing an $18.2 billion contraction — a signal of persistent distribution despite the expanding holder base.
Technically, SOL is trading in a compression zone between $79 and $84. Analyst Ali Martinez identifies clear resistance at $96.04 and a solid support anchored at $76.66. A decisive breakdown below this threshold could trigger a pullback to the yearly low of $68.54, with a possible extension toward $50. Conversely, holding current support levels could catalyze a return to the $81-$85 zone.
The institutional context adds an important nuance. Spot Solana ETFs in the US feature around eight sponsors at the end of Q1 2026, with the Bitwise BSOL product on the NYSE as the largest holder. These funds represent roughly $805.84 million in net assets, or about 1.69% of Solana’s total market capitalization. These are real inflows, but still too limited to support a genuine bullish breakout.
NEAR and SEI: Two Paradoxes to Understand
NEAR Protocol is trading at $1.37 with 2.5 million active users, surpassing Solana in traffic volume. Yet, its price action remains underwhelming. NEAR and Solana illustrate how adoption can lead to price cycles driven by momentum rather than stable fundamentals. Without a specific catalyst — a major partnership, a protocol upgrade, or institutional entry — user activity alone is not enough to trigger a sustainable uptrend.
SEI represents the most striking paradox in the ranking. Despite its presence in the top 5, SEI’s price has suffered significantly due to supply-side pressure and declining capital retention. The CMF indicates a loss of liquidity, while the RSI remains anchored below its moving average. The price is expected to trend downward despite the surge in network traffic. SEI is a textbook example of the potential disconnect between usage metrics and price performance.
Adoption Alone Does Not Fuel Rallies
The takeaway from this ranking is clear. High user activity does not automatically translate into price strength. BNB and TRON show how sustained usage can support stability, whereas Solana and NEAR reflect price cycles driven by momentum.
For traders tracking these networks on exchanges, the key signal to watch remains the same: capital flows, not just the number of active addresses. The $76 zone on SOL remains the ultimate litmus test for April. A confirmed bounce with volume would pave the way toward $85, then $96. A breakdown below this threshold, amid a still unstable geopolitical backdrop, would expose the asset to a deeper correction. When tracking price predictions for these Layer-1s, this is the level to keep on your radar in the coming days.
Sources:
- cryptorand on X
- TradingView
- X (@ali_charts / @CoinBureau)
Related Articles:

