Why the TRUMP Token Could Surge in the Next Few Hours
After dropping nearly 80% over the last 90 days, the official Trump token (TRUMP) might be gearing up for a major trend reversal. Technical analysts have identified a promising harmonic pattern on the chart, hinting at an upcoming bullish move.
Is a Rebound in Sight for the Official Trump Token (TRUMP) ?
As the cryptocurrency market is going through a challenging period, with a significant drop of over 45% for Ethereum (ETH) in the first quarter of 2025, the official memecoin Trump (TRUMP) is no exception. However, an encouraging technical signal could indicate a trend reversal for this controversial crypto.
Over the past few weeks, TRUMP has managed to return to positive weekly gains, reducing its 90-day slide to around 79%. Interestingly, a harmonic pattern forming on the daily chart could herald a strong rebound ahead.
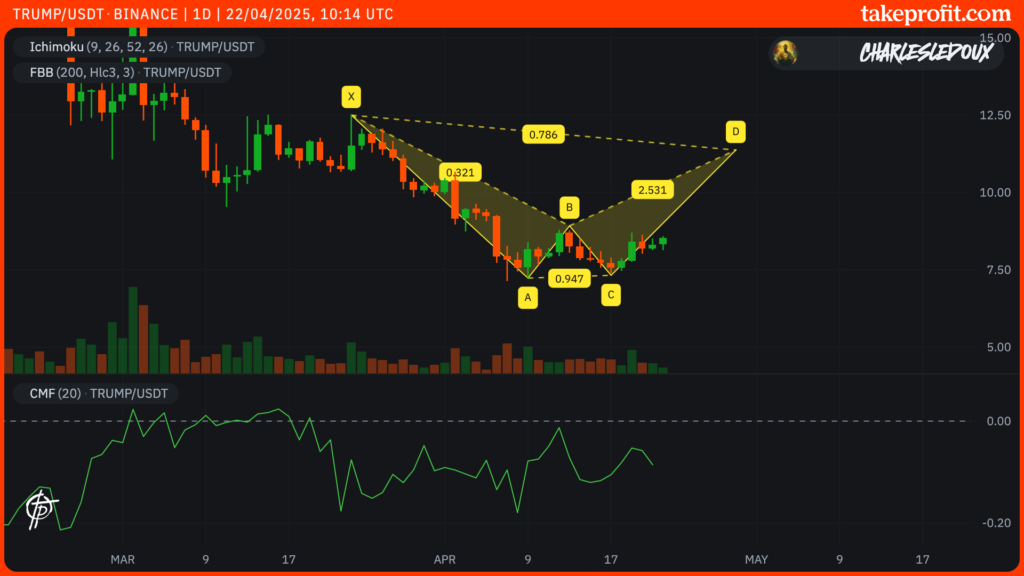
On the daily chart of TRUMP, a potential formation of a bearish Gartley structure can be observed. Although this type of pattern typically signals a trend reversal once completed, it also allows for a significant bullish movement before reaching this crucial point.
The sharp decline of TRUMP began around March 23, after its failure to stay above the resistance of $12.43 (marked as point X). Since then, it has lost nearly 42% of its value, hitting a low of $7.15 on April 7 (point A). Leg AB has only retraced by 30.9%, slightly less than the typical range of 38.2% to 61.8% Fibonacci levels – but the entire harmonic configuration remains strong and valid.
Following leg BC, the momentum has clearly reversed. TRUMP has bounced back from around $7.40 (point C) and is currently working on the CD leg of the pattern, with increasing movement strength.
If the pattern continues to unfold, TRUMP could surge towards the final target at point D, located around $11.30 – a move that would represent approximately 33% increase from the current price near $8.53.
What Does the Future Hold for the token ?
If the bullish momentum continues, TRUMP could climb towards the $11.30 zone in the coming days. This zone not only completes the Gartley harmonic structure but also corresponds to a 78.6% retracement of X-C momentum – making it a major technical resistance to closely monitor.
However, caution is advised. In harmonic trading, once point D is reached, a reversal or heavy profit-taking is often expected.
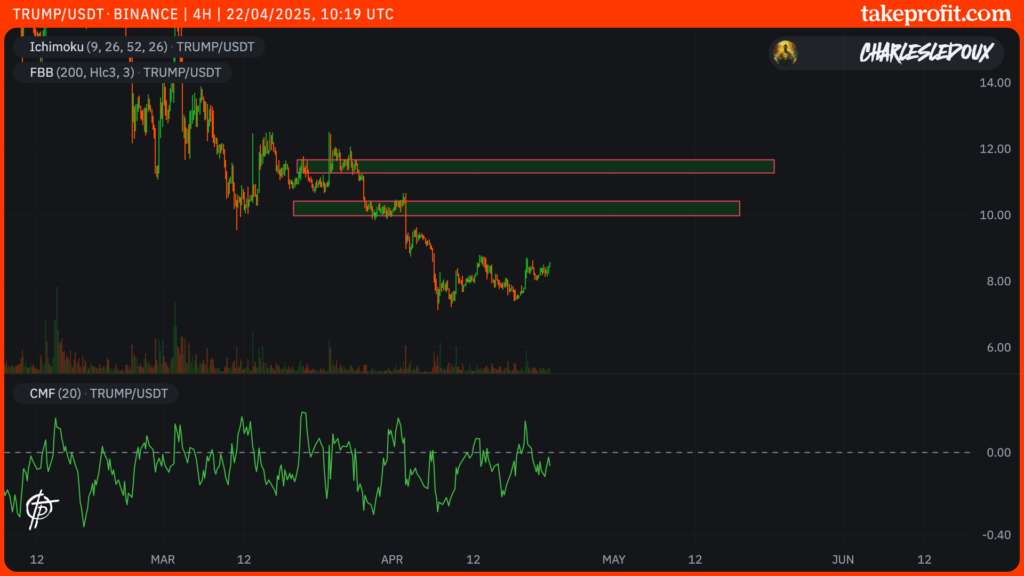
Before reaching $11.30, TRUMP will also encounter a strong liquidity zone to pass at $10.
In conclusion, although TRUMP has experienced a significant decline in recent months, current technical signs suggest the possibility of a significant rebound ahead. However, as always in cryptocurrency trading, it is essential to remain cautious and always do your own research before making an investment decision.
Charles Ledoux is a Bitcoin and blockchain technology specialist. A graduate of the Crypto Academy, he has been a Bitcoin miner for over a year. He has written numerous masterclasses to educate newcomers to the industry and has authored over 2,000 articles on cryptocurrency. Now, he aims to share his passion for crypto through his articles for InvestX.
DISCLAIMER
This article is for informational purposes only and should not be considered as investment advice. Some of the partners featured on this site may not be regulated in your country. It is your responsibility to verify the compliance of these services with local regulations before using them.
DISCLAIMER
This article is for informational purposes only and should not be considered as investment advice. Trading cryptocurrencies involves risks, and it is important not to invest more than you can afford to lose.
InvestX is not responsible for the quality of the products or services presented on this page and cannot be held liable, directly or indirectly, for any damage or loss caused by the use of any product or service featured in this article. Investments in crypto assets are inherently risky; readers should conduct their own research before taking any action and invest only within their financial means. This article does not constitute investment advice.
Risk Warning : Trading financial instruments and/or cryptocurrencies carries a high level of risk, including the possibility of losing all or part of your investment. It may not be suitable for all investors. Cryptocurrency prices are highly volatile and can be influenced by external factors such as financial, regulatory, or political events. Margin trading increases financial risks.
CFDs (Contracts for Difference) are complex instruments with a high risk of rapid capital loss due to leverage. Between 74% and 89% of retail investor accounts lose money when trading CFDs. You should assess whether you understand how CFDs work and whether you can afford to take the high risk of losing your money.
Before engaging in financial or cryptocurrency trading, you must be fully informed about the associated risks and fees, carefully evaluate your investment objectives, level of experience, and risk tolerance, and seek professional advice if needed. InvestX.fr and the InvestX application may provide general market commentary, which does not constitute investment advice and should not be interpreted as such. Please consult an independent financial advisor for any investment-related questions. InvestX.fr disclaims any liability for errors, misinvestments, inaccuracies, or omissions and does not guarantee the accuracy or completeness of the information, texts, graphics, links, or other materials provided.
Some of the partners featured on this site may not be regulated in your country. It is your responsibility to verify the compliance of these services with local regulations before using them.
Get 6200 USDT with Bitget ! 🔥
Don't miss out on this offer !
Create your account now to unlock this exclusive reward