

The Bitcoin Renaissance as a Safe Haven Asset
Bitcoin has reestablished a positive correlation with gold, historically favorable for its appreciation. Since March, the cryptocurrency has surged by over 10% while gold gained 5%, indicating a renewed interest in assets resistant to inflation.
This trend comes with a noticeable decline in the U.S. Dollar Index (DXY), down by 4%. This trend further enhances Bitcoin’s appeal as a safe haven asset against expansionary monetary policies.
Since 2020, the correlation coefficient between Bitcoin and gold has dropped below -0.50 18 times. In 94% of cases, it then bounced back above +0.50 in less than a week, indicating a new bullish cycle on the horizon.
Bitcoin Outpacing Gold and the S&P 500
Bitcoin is not only catching up with gold; it now significantly outperforms it in terms of performance. According to macroeconomic analyst @TedPillows, BTC has seen an increase of nearly 25% from its low, surpassing both the yellow metal and the S&P 500 index.
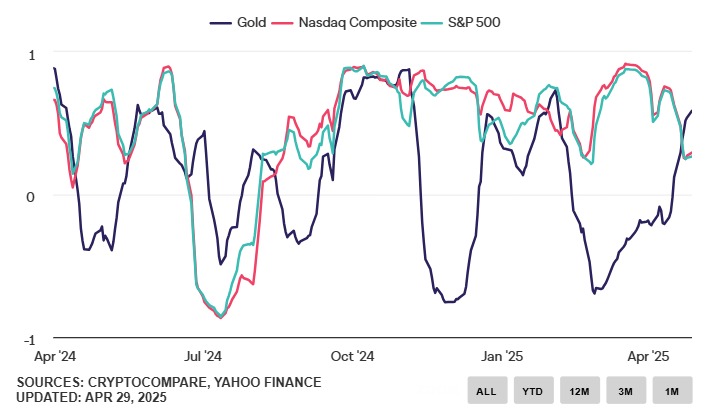
This shift in capital flows in favor of high beta assets like Bitcoin reflects the increasing appetite of institutional investors for cryptocurrencies. A trend expected to strengthen amid macroeconomic uncertainty.
Key points to monitor :
- Bitcoin’s continued outperformance compared to gold and stocks
- The persistent downward pressure on the U.S. dollar
- Increased attraction to deflationary assets, with Bitcoin leading the way
Bitcoin Recovery Boosted by U.S. Policy
The recent Bitcoin rebound, coinciding with the announcement by Trump of new tariffs, has reignited geopolitical concerns and the narrative of Bitcoin as a safe haven asset. The cryptocurrency’s price surged by 10%, while gold gained 5% and the DXY fell by 4%.
This tense scenario has increased investors’ interest in BTC, a rare digital asset independent of sovereign monetary policies. A trend expected to continue as macro uncertainty grows.
Aim for $98,000 for BTC
From a chartist perspective, Bitcoin is consolidating above $95,000 in a well-defined uptrend channel. The 50-day Exponential Moving Average (EMA50), currently at $94,015, acts as a dynamic support.
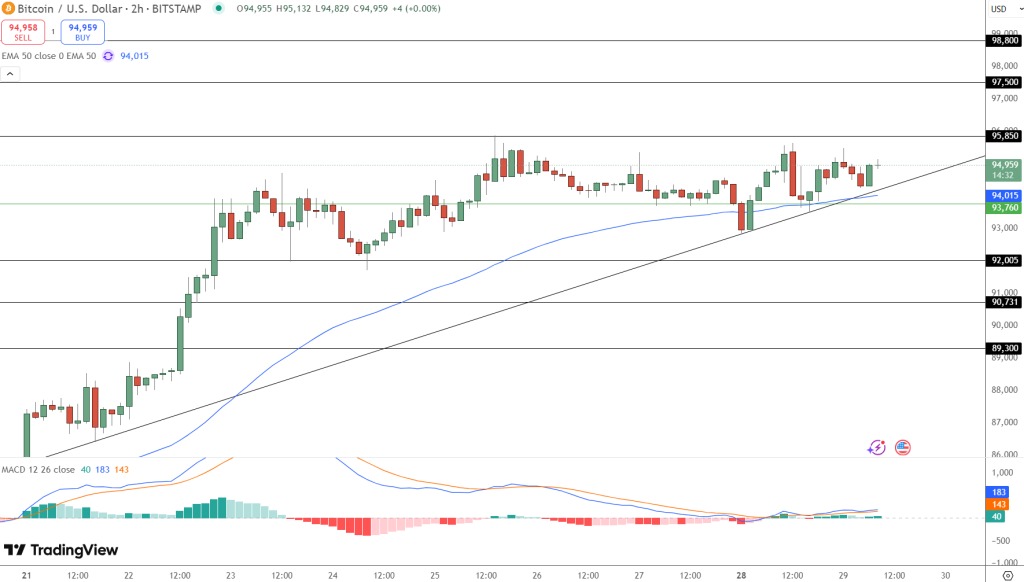
Key levels for traders:
- Buy level: above $96,000 with strong volume
- Stop-loss: below $94,000
- Price targets: $97,500 then $98,800
Although the MACD indicator is currently neutral, a buying surge could trigger an impulsive move towards new highs.

