

Bearish Context Weighs on XRP Since Mid-October
The cryptocurrency market has not regained its composure since the brutal selloff of October 10th. This correction particularly impacted Ethereum, which has posted a decline of nearly 27% over the past 60 days, dragging down all major altcoins in its wake. XRP has not escaped this widespread selling pressure.
The altcoin has dropped more than 25% over the same period, reflecting an overall cautious market sentiment and an absence of bullish catalysts powerful enough to reverse the trend. Trading volumes have remained relatively low, a sign that investors prefer to wait for clearer signals before repositioning themselves.
However, beneath this apparent lethargy, the daily chart is beginning to reveal an interesting technical structure. Traders familiar with harmonic analysis may spot the emergence of a promising setup, capable of transforming this consolidation phase into a launchpad for a medium-term recovery.
A Bullish Cypher Pattern Emerges on the Daily Chart
On the daily timeframe, XRP appears to be forming a bullish harmonic Cypher pattern, a technical configuration renowned for generating impulsive movements when price reaches its Potential Reversal Zone (PRZ). This type of structure relies on precise Fibonacci ratios and offers clearly defined entry and exit points.
The pattern began at point X near $2.69, where XRP marked its local top before initiating a correction. The price then traced point A, followed by a rebound to point B around the 0.382 retracement. From there, a new bearish leg led XRP to point C around $1.77, a zone where buying pressure is beginning to manifest.
Since that bottom, XRP has been trading around $1.86, displaying a gradual recovery. This rebound suggests that selling pressure is fading and that buyers are actively defending recent lows.
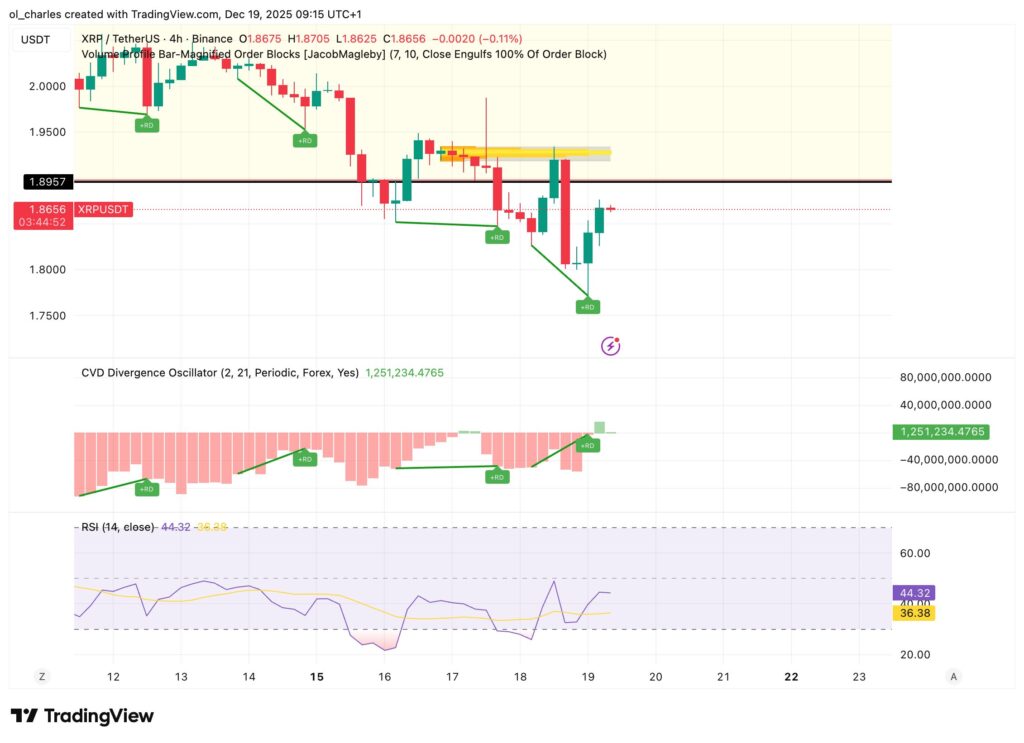
Furthermore, 4 bullish divergences in the CVD and a bullish divergence in the RSI appear on the 4-day chart. This gives reason for optimism regarding a bounce toward $2 at minimum.
Critical Levels to Watch for XRP
In the short term, the support at $1.77 represents the major technical pivot. As long as XRP holds above this zone, the harmonic pattern remains valid and the bullish continuation scenario via the CD leg remains on the table. A loss of this level would invalidate the configuration and expose the altcoin to increased downward pressure.
The 4-hour order block observed sits between $1.93 and $1.91. This resistance zone will be crucial in the coming days.
If price continues to strengthen, the next major obstacle lies at the 50-day moving average level, close to $2.16. A clean break above this resistance would signal a notable improvement in momentum and could catalyze a bullish acceleration toward the pattern’s targets.
According to the harmonic structure, upside targets lie within the PRZ, between the Fibonacci 0.786 extension near $2.50 and the 1.0 extension around $2.69. This zone theoretically marks the completion of the Cypher pattern and the point where stronger resistance or a pause in the movement could emerge, prompting traders to secure their profits.
Related Articles:

