

An Uneven and Selective Altcoin Market
Since the local bottom in early February, the cryptocurrency market has begun a recovery. The Total3, which measures the market capitalization of all altcoins excluding Bitcoin and Ethereum, has increased by more than 15% during this period. The recovery is evident, but it remains deeply uneven across different assets.
Some tokens have delivered exceptional performances. HYPE has surged nearly 190% since the February lows. This outperformance reflects a specific combination: real utility growth, institutional momentum, and accumulation by crypto whales. The majority of altcoins have not replicated this profile. The market remains in a phase of selective rotation, not in a generalized bull run.
In this environment, fundamental analysis of on-chain flows has become the most reliable tool for anticipating capital movements. Price data alone is no longer sufficient. Darkfost argues that exchange flows can identify institutional repositioning before it is reflected in prices. This is precisely what the Chainlink data is signaling.
Whale Withdrawals at Their Highest Since 2025
The signal documented by Darkfost is precise. The 10 largest withdrawal transactions on Binance for LINK have reached their highest level since 2025. Throughout May, the average daily withdrawals from the largest transactions exceeded 3,600 LINK. Several individual sessions recorded spikes above 5,000 LINK withdrawn in a single day.
These movements are not ordinary portfolio adjustments. They represent the behavioral signature of actors making deliberate, large-scale decisions to move LINK from exchanges to external wallets. This behavior is historically associated with a long-term holding intention. Massively withdrawing from an exchange signals that one does not plan to sell in the short term.
What makes this signal particularly relevant is the price context in which it occurs. These record withdrawals are accumulating while LINK is still 66% below its cycle highs. The participants generating these withdrawals are not buying into strength. They are building positions at significantly discounted levels, a behavioral profile consistent with long-term conviction rather than opportunistic swing trading.
Technical Structure: Consolidation Below Key Resistance
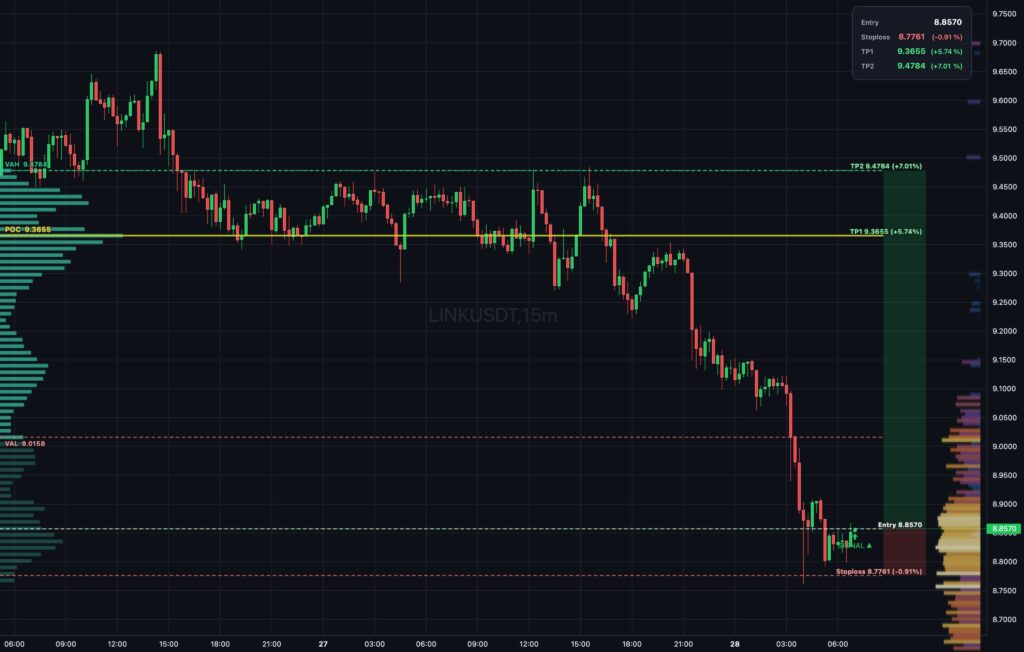
From a technical analysis standpoint, Chainlink remains trapped in a prolonged consolidation below the psychological level of $10. The daily chart shows LINK struggling to establish sustained bullish momentum. Repeated attempts to reclaim the resistance zones at $10.50 and $11 have all failed to produce a convincing close.
The technical structure remains fragile yet stable. LINK is trading around the convergence zone of short-term moving averages, reflecting the prevailing indecision. The 50-day moving average has flattened after months of decline. The 100 and 200-day moving averages continue to point downward, signaling that the macro bearish trend has not yet fully reversed. The RSI remains neutral, without any overextension in either direction.
However, a positive technical element is emerging. Since the violent break in February, LINK has consistently formed higher lows in the $8.50-$9.00 range. Buyers are systematically absorbing selling pressure whenever the price approaches this key support/resistance. As long as this zone holds, the overall accumulation structure remains intact despite the absence of immediate bullish expansion.
Can LINK Break $10 Soon?
The price forecast for LINK depends on the convergence between on-chain data and technical confirmation. The signal from Darkfost is clear on one point: exchange flows alone do not guarantee a structural reversal. An on-chain signal requires corroboration before it becomes an actionable conclusion. Methodological caution is warranted in the face of an isolated indicator, no matter how significant it may be.
What the current data confirms, however, is that a segment of the market has made a silent and deliberate decision regarding LINK. These actors are repositioning well before the price has given any public confirmation. This behavior historically precedes expansion phases in crypto trading. For those looking to invest in crypto in LINK, the $8.50-$9.00 zone serves as the reference floor to watch.
The bullish scenario hinges on two specific triggers. A daily close above $10.50 with volume would activate the algorithms of day trading and breakout traders. Beyond that, the $11 and then $13 zones represent the first acceleration targets. The open interest on LINK futures remains measured, which means that the next bullish move will not be hindered by existing excess leverage. The overall crypto trend remains the determining external catalyst.
Sources:
- Darkfost_Coc on X
- Tradingview
Related Articles:

