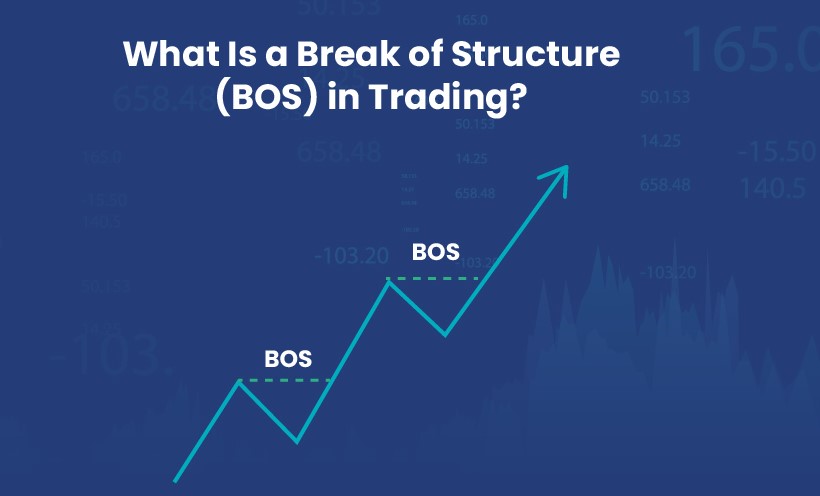
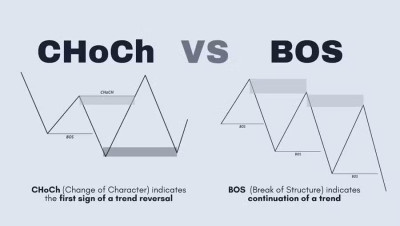
What is a BOS (Break of Structure) ?
The Break of Structure, commonly referred to as BOS, represents the precise moment when an asset’s price breaks through a significant resistance or support level, thus confirming the continuation of the current trend.
Technical Definition of BOS
A BOS materializes when the price exceeds an important pivot point in the direction of the main trend. In an uptrend, this corresponds to the breakout of a previous swing high, while in a downtrend, it involves the breaking of a previous swing low. This breakout constitutes a technical validation of the market’s directional strength and indicates that the dominant participants maintain their control.
The distinctiveness of a BOS lies in its ability to confirm trend continuation. Unlike false breakouts that trap inexperienced traders, a genuine BOS is typically accompanied by significant volume and sustained price momentum. This technical characteristic makes it a particularly valued signal among professional traders who seek durable and profitable directional movements.
Identifying an authentic BOS requires rigorous analysis of several converging factors. Momentum must be present at the moment of breakout, demonstrating real engagement from market participants. Additionally, the surrounding market structure must support the directional movement, with an absence of major technical divergences.
Types of BOS
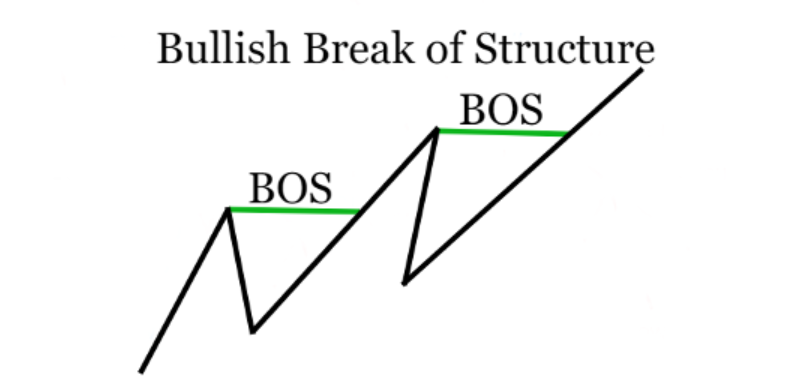
A bullish BOS occurs when the price breaks above the last significant peak in an uptrend. This breakout indicates that buyers maintain control over the market. The break should happen with above-average volume, and the price must maintain its position above the broken level.
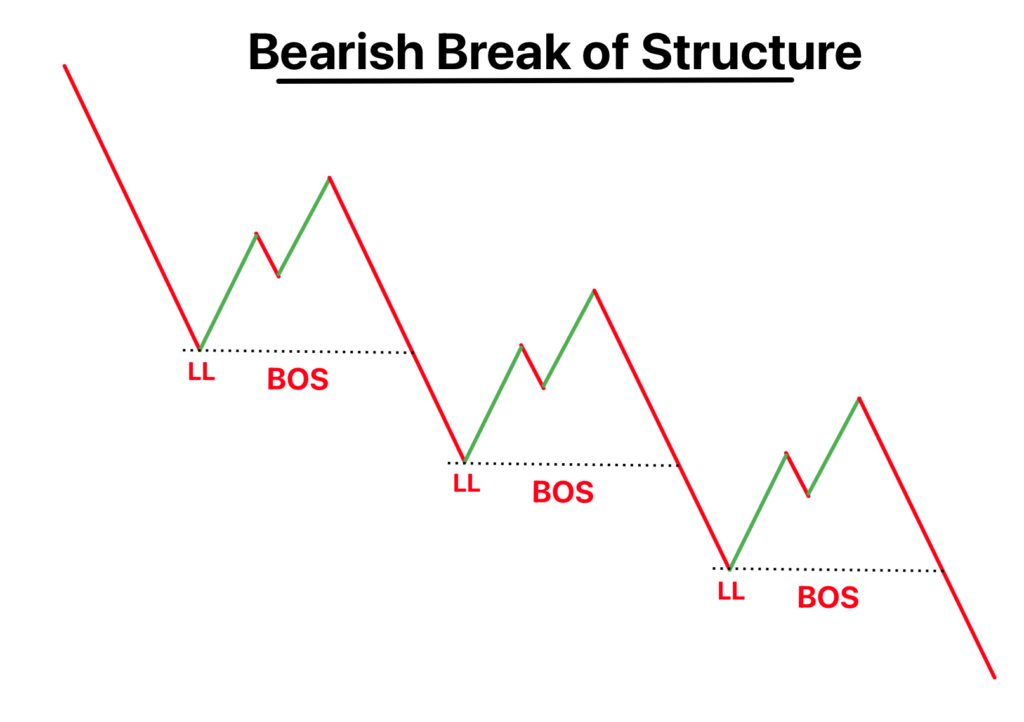
A bearish BOS happens when the price breaks below the last important trough in a downtrend. This rupture signals that sellers maintain their dominance and that selling pressure remains sufficiently intense to drive prices toward new lows.
The effectiveness of a BOS largely depends on the timeframe being observed. A BOS identified on a daily chart generally has greater scope and reliability than one detected on an hourly chart. Professional traders use a multi-timeframe approach to validate their signals.
What is a CHoCH (Change of Character) ?
The Change of Character, abbreviated as CHoCH, constitutes one of the most powerful signals for anticipating trend reversals. This concept allows traders to identify moments when market dynamics shift, potentially signaling a major change in direction.
Definition and Mechanism of CHoCH
A CHoCH manifests when the established market structure begins to show characteristic signs of weakness. Unlike the BOS which confirms continuation, the CHoCH reveals the exhaustion of the current trend and the emergence of an opposing directional force. This transition typically occurs gradually, allowing attentive traders to detect precursor signals.
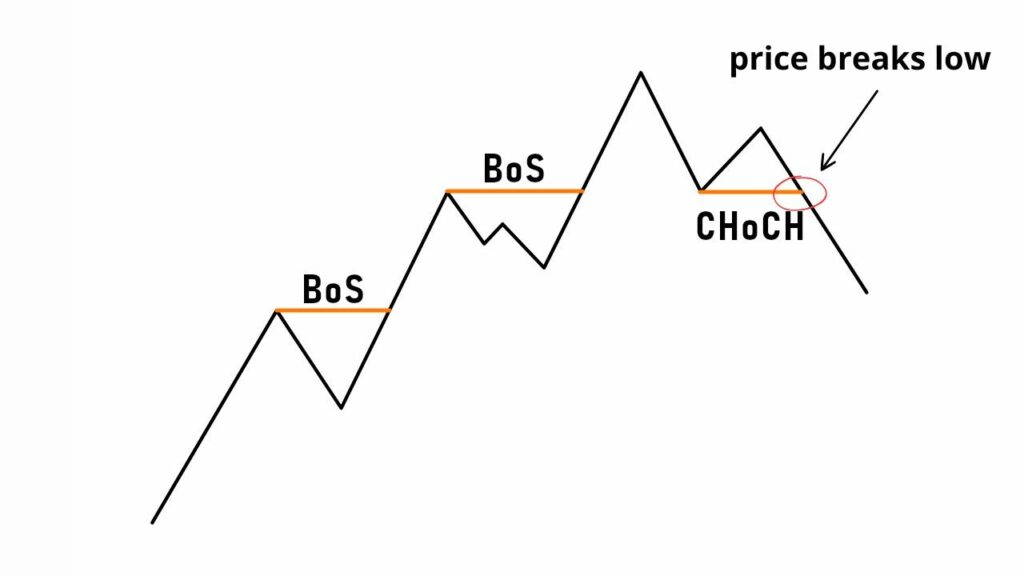
In an uptrend, a CHoCH materializes when the price fails to form a new higher high and begins to break previous higher lows. This rupture of the ascending structure indicates that buyers are progressively losing control and that the balance of forces is shifting in favor of sellers. The reverse process is observed in a downtrend, where the inability to form new lower lows and the breaking of lower highs signal a weakening of selling pressure.
The market psychology plays a crucial role in the formation of CHoCHs. When dominant participants begin to doubt the sustainability of the trend, their buying or selling behaviors change, creating conditions conducive to a reversal. This behavioral dynamic explains why CHoCHs often constitute major and lasting inflection points.
Variations of CHoCH
A bullish CHoCH occurs in a downtrend that shows signs of exhaustion. This signal triggers when the price breaks above the last significant lower high, breaking the descending structure. Volume should accompany this breakout, demonstrating renewed interest from buyers.
A bearish CHoCH emerges in an uptrend that exhibits signs of fatigue. This signal triggers when the price breaks below the last important higher low, breaking the ascending structure and suggesting a shift toward a bearish dynamic.
The CHoCH reflects a fundamental change in the collective psychology of market participants. This dynamic explains why CHoCHs often constitute major inflection points in financial markets.
How to Identify BOS and CHoCH ?
Precisely identifying BOS and CHoCH relies on a rigorous methodology and the use of specialized technical tools.
Identification Methodology
The first step is to correctly determine significant swing highs and swing lows. A valid swing high is characterized by a peak surrounded by at least two candles on either side presenting lower peaks. This technical configuration ensures that the identified point constitutes a significant temporary resistance level.
The confirmation period plays a crucial role. On a daily chart, a minimum of 2 to 3 confirmation candles is generally required to validate a swing high or low. This temporal requirement helps avoid false signals generated by short-term fluctuations.
Using appropriate tracing tools facilitates the identification of BOS and CHoCH. Structural trendlines constitute a particularly effective tool. By connecting successive swing highs in an uptrend, or swing lows in a downtrend, traders create clear visual references to identify breakout moments.
Support and resistance zones offer a complementary approach. This method considers price areas where historical reactions have been significant, taking into account the natural volatility of markets.
Multi-timeframe Analysis
Multi-timeframe analysis represents an advanced technique essential for validating signals. This approach consists of examining the structure on multiple time units simultaneously. The standard methodology involves using at least three different timeframes: a primary one for directional analysis, a higher one for general context, and a lower one for entry timing.
Complementary Indicators
Volume represents the most important indicator for validating breakouts. A BOS or CHoCH accompanied by above-average volume has a significantly higher probability of success. Momentum oscillators like the RSI can also provide valuable confirmations.
To minimize the impact of false breakouts, traders use strict confirmation criteria: price maintenance beyond the broken level for a minimum duration, significant volume, and formation of new pivot points. The 50% rule constitutes a practical tool: if the price retraces more than 50% of the breakout movement, this suggests a high probability of a false breakout.
How to Use BOS and CHoCH in Trading ?
The practical application of BOS and CHoCH concepts requires a methodical approach that integrates these signals into a comprehensive risk management strategy.
Entry Strategies Based on BOS
Using BOS for entries is based on the principle of trend continuation. The pullback strategy constitutes the most common and effective approach. After breaking a structural level, the price frequently returns to the broken zone, creating an optimal entry point with a favorable risk/reward ratio.
This retest phase offers several strategic advantages. It allows entering a position with a tight stop-loss, typically placed below the newly formed support level. Additionally, it confirms the validity of the breakout by demonstrating that the former resistance level has become solid support.
The pending order technique allows automating these pullback entries. By placing a limit buy order in the anticipated retest zone, traders can capture the continuation movement without constantly monitoring charts. This disciplined approach avoids emotional decisions and improves trading result consistency.
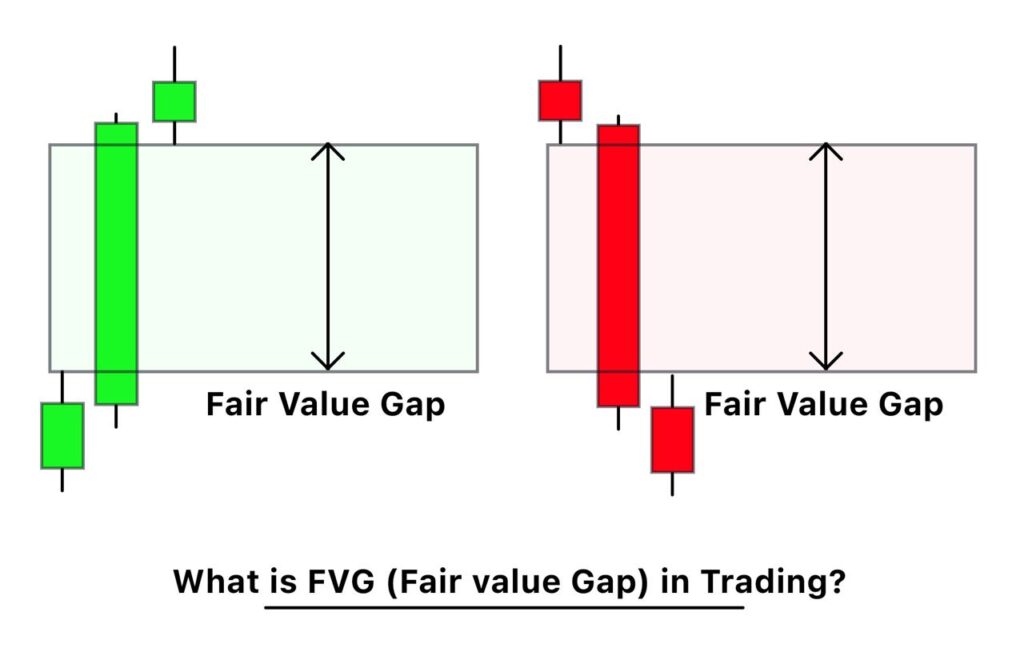
FVGs (Fair Value Gaps) that form during significant breakouts offer particularly attractive entry opportunities. These temporary imbalances between supply and demand create voids on the chart that price tends to fill, generating entry points with excellent profit potential.
Exploiting CHoCH Signals
CHoCH signals offer opportunities to identify trend reversals early. The multiple confirmation strategy requires the convergence of several elements: structure breakout, significant volume, formation of new pivot points, and confirmation by momentum indicators.
Scaled entry represents an advanced technique adapted to CHoCH signals. This method consists of dividing the entry into several tranches: first position during the initial breakout, second during the retest, and third after confirmation of the new structure.
Position Management
Position management based on BOS and CHoCH concepts requires a dynamic approach. For positions opened on BOS signals, primary objectives can correspond to Fibonacci extensions calculated from the breakout movement. The 127.2% and 161.8% levels constitute statistically probable profit-taking zones.
Positions based on CHoCH signals require a more flexible approach. Using trailing stops based on structure allows capturing maximum profit while protecting acquired gains.
The effectiveness of BOS and CHoCH strategies improves when combined with other technical analysis tools. Supply and demand zone analysis constitutes a natural complement. Patterns also offer an interesting predictive dimension when they converge with BOS or CHoCH signals.
Adaptation to different markets is crucial. For example, in crypto markets, breakout movements tend to be more explosive but more susceptible to generating false breakouts. Forex markets present more fluid movements but more limited ranges.
Why Integrate Them Into Your Trading ?
Integrating BOS and CHoCH concepts brings considerable advantages that transform the analytical approach and improve long-term performance.
Improved Accuracy
The systematic use of BOS and CHoCH allows achieving a level of analytical precision superior to traditional methods. These concepts offer an objective reading grid of market structure, reducing subjectivity in price movement interpretation.
Probability quantification constitutes one of the main advantages. A BOS confirmed across multiple timeframes has a statistically higher probability of success than an isolated signal. This precision translates into a significant reduction in false signals.
Risk/Reward Ratio Optimization
Applying these concepts allows considerably optimizing the risk/reward ratio of trades. The identified optimal entry points minimize initial risk while maximizing profit potential. This approach generates average ratios between 1:2 and 1:4, significantly superior to traditional methods.
Reduction of Emotional Impact
Using an objective methodology helps reduce the impact of emotions on trading decisions. The clarity of signals eliminates much of the uncertainty that generates stress and anxiety. This analytical discipline translates into improved consistency of results.
Adaptability to Market Conditions
BOS and CHoCH concepts naturally adapt to different market conditions. In trending markets, BOS signals help identify continuation opportunities. During consolidation phases, CHoCH offers early signals for range breakouts.
Integration into algorithmic strategies opens interesting perspectives. Rule codification allows creating algorithms capable of simultaneously scanning hundreds of assets. This macro-structural approach helps develop a coherent overall vision.
The evolution of financial markets in 2026 confirms the growing relevance of BOS and CHoCH concepts in the modern trader’s arsenal. Increased volatility and algorithm sophistication make these tools more valuable than ever.
The emergence of decentralized markets and the massive adoption of cryptocurrencies create new environments where traditional analysis shows its limitations. BOS and CHoCH concepts naturally adapt to these new paradigms.
The democratization of advanced analysis tools allows retail traders to access methodologies once reserved for institutions. The training investment necessary to master these techniques represents a sustainable competitive advantage in the current market environment.