Why is Bitcoin dropping today? Market analysis & potential correction
Bitcoin's price is falling. Explore the reasons behind the decline, including market pressures. Will a major correction follow? Get the latest analysis.


Bitcoin's price is falling. Explore the reasons behind the decline, including market pressures. Will a major correction follow? Get the latest analysis.
The crypto market is navigating a phase of macroeconomic turbulence that few investors anticipated with such intensity. Two exogenous factors are currently dominating price action: the monetary policy of the Bank of Japan (BoJ) and the military escalation in the Strait of Hormuz. Combined, they create a risk-off environment that weighs heavily on all speculative assets, led by Bitcoin.
For investors looking to understand cryptocurrencies and their sensitivity to macro conditions, this market moment is particularly instructive.
The Bank of Japan maintained its benchmark interest rate at 0.75% during its March 2026 meeting. However, the signals sent by Governor Kazuo Ueda are far from trivial. Traders were pricing in a 69% probability of a rate hike at the April 28 meeting, according to Bloomberg data. One policy board member even explicitly called for stronger tightening in response to the inflationary impact of the Middle East conflict on Japanese society.
To understand why Tokyo is of such interest to crypto traders, we must look back at the mechanics of the yen carry trade. For years, capital borrowed at near-zero rates in Japan has been reinvested into higher-yielding assets, including cryptocurrencies. An accommodative BoJ keeps the yen weak, hovering around 160 against the dollar. This preserves cheap funding for long positions on Bitcoin via perpetual futures markets. Turning off this tap, even partially, triggers forced liquidations across all risk assets.
During the 25 basis point hike decided in January 2026, Bitcoin dropped by nearly 3% in the hours following the announcement. Bank of America warns that a further hike toward 1% could generate an additional 4 to 5% of downward pressure. This could potentially drag BTC back down to the $60,000 zone.
In parallel, the US-Iran crisis has introduced a variable that crypto valuation models struggle to price in accurately. In late January, Iran bolstered its naval presence around the Strait of Hormuz, causing WTI crude to surge from $73 to $118 in two months. This maritime corridor is critical for Japan: over 90% of its oil imports pass through this chokepoint. A prolonged blockade directly fuels Japanese inflation, mechanically increasing the pressure on the BoJ to act.
The US Consumer Price Index rose by 0.9% in March 2026, driven primarily by rising energy costs linked to the conflict. Core inflation, however, surprised to the downside at +0.2%, against an expected 0.3%. This divergence between headline and core inflation complicates the reading for central banks and sustains market uncertainty.
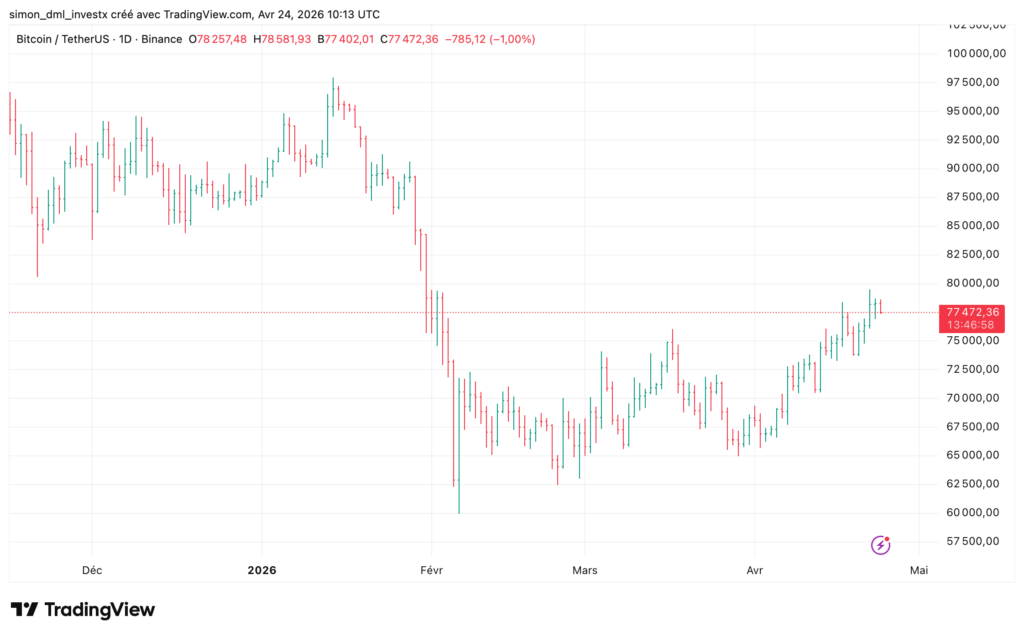
WTI climbed to around $95, up from $79 the previous week, while bond yields advanced across major economies. Analysts warn that Bitcoin’s recent rally toward $80,000 relies primarily on perpetual futures demand rather than spot buying, which heightens the risk of a correction if spot demand continues to contract.
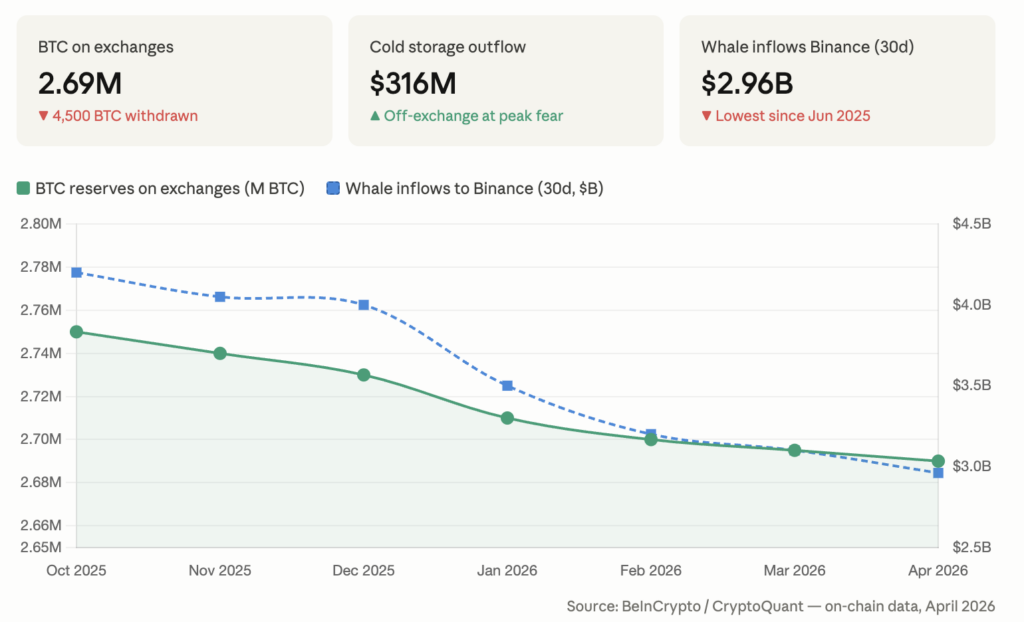
A surface-level reading suggests panic selling, but on-chain data tells a more nuanced story. Global Bitcoin reserves on exchanges have dropped to roughly 2.69 million BTC, with around 4,500 BTC withdrawn to cold storage at the peak of geopolitical uncertainty, representing $316 million moved off platforms.
Whale inflows on Binance over the last 30 days have fallen to $2.96 billion, their lowest level since June 2025. This behavior is consistent with a phase of quiet accumulation rather than massive distribution. Smart money is not fleeing Bitcoin: it is moving it out of the market’s reach.
For active investors who use these signals in their trading strategy, the distinction between institutional accumulation and retail selling is a crucial timing indicator. Knowing how to buy cryptocurrencies during these price compression windows requires discipline but can prove decisive for ultimate returns.
Our analysis clearly leans toward structural market noise, albeit with important nuances. The BoJ ultimately kept its rates unchanged during the April 28 meeting. Governor Ueda signaled a more cautious stance regarding the uncertainties of the Iranian conflict on the Japanese economy, which contributed to Bitcoin’s recovery above $74,000.
However, a delay is not an abandonment. Wage dynamics in Japan remain solid, with salary increases hovering around 5.15%. The more pronounced impact of energy prices and exchange rates argues for an earlier-than-expected monetary adjustment. An additional tightening of 25 basis points in the second half of 2026 remains the baseline scenario for many economists.
The real risk is therefore not immediate, but deferred. If US-Iran negotiations fail long-term and oil returns to $110, the BoJ will find itself under pressure to act urgently. This scenario would constitute a far more brutal global liquidity shock than the one seen in January for crypto assets.
In the meantime, technical supports around $73,000 to $75,000 remain key reference zones to monitor for any exposure decisions on available crypto exchanges.
Sources:
Related Articles:

Crypto analyst with over 7 years of trading experience and a strong background in the iGaming and cryptocurrency industries, I cover crypto news with a rigorous yet accessible approach. Passionate about blockchain since 2019, I have published more than 1,200 articles and guides on cryptocurrencies, DeFi, and blockchain, recognized for their reliability and clarity.
Specializing in on-chain trading and whale activity analysis, I decode blockchain flows to anticipate market trends before they become obvious.
One of my articles was cited by Éric Larchevêque, co-founder of Ledger, highlighting the quality and credibility of my analysis.
My goal remains unchanged: to make crypto accessible and understandable for everyone, from beginners to experienced investors.
Follow me on LinkedIn and X to stay updated with my latest insights.
DISCLAIMER
This article is for informational purposes only and should not be considered as investment advice. Trading cryptocurrencies involves risks, and it is important not to invest more than you can afford to lose.
InvestX is not responsible for the quality of the products or services presented on this page and cannot be held liable, directly or indirectly, for any damage or loss caused by the use of any product or service featured in this article. Investments in crypto assets are inherently risky; readers should conduct their own research before taking any action and invest only within their financial means. This article does not constitute investment advice.
Risk Warning : Trading financial instruments and/or cryptocurrencies carries a high level of risk, including the possibility of losing all or part of your investment. It may not be suitable for all investors. Cryptocurrency prices are highly volatile and can be influenced by external factors such as financial, regulatory, or political events. Margin trading increases financial risks.
CFDs (Contracts for Difference) are complex instruments with a high risk of rapid capital loss due to leverage. Between 74% and 89% of retail investor accounts lose money when trading CFDs. You should assess whether you understand how CFDs work and whether you can afford to take the high risk of losing your money.
Before engaging in financial or cryptocurrency trading, you must be fully informed about the associated risks and fees, carefully evaluate your investment objectives, level of experience, and risk tolerance, and seek professional advice if needed. InvestX.fr and the InvestX application may provide general market commentary, which does not constitute investment advice and should not be interpreted as such. Please consult an independent financial advisor for any investment-related questions. InvestX.fr disclaims any liability for errors, misinvestments, inaccuracies, or omissions and does not guarantee the accuracy or completeness of the information, texts, graphics, links, or other materials provided.
Some of the partners featured on this site may not be regulated in your country. It is your responsibility to verify the compliance of these services with local regulations before using them.
