

Why did the STABLE price explode today?
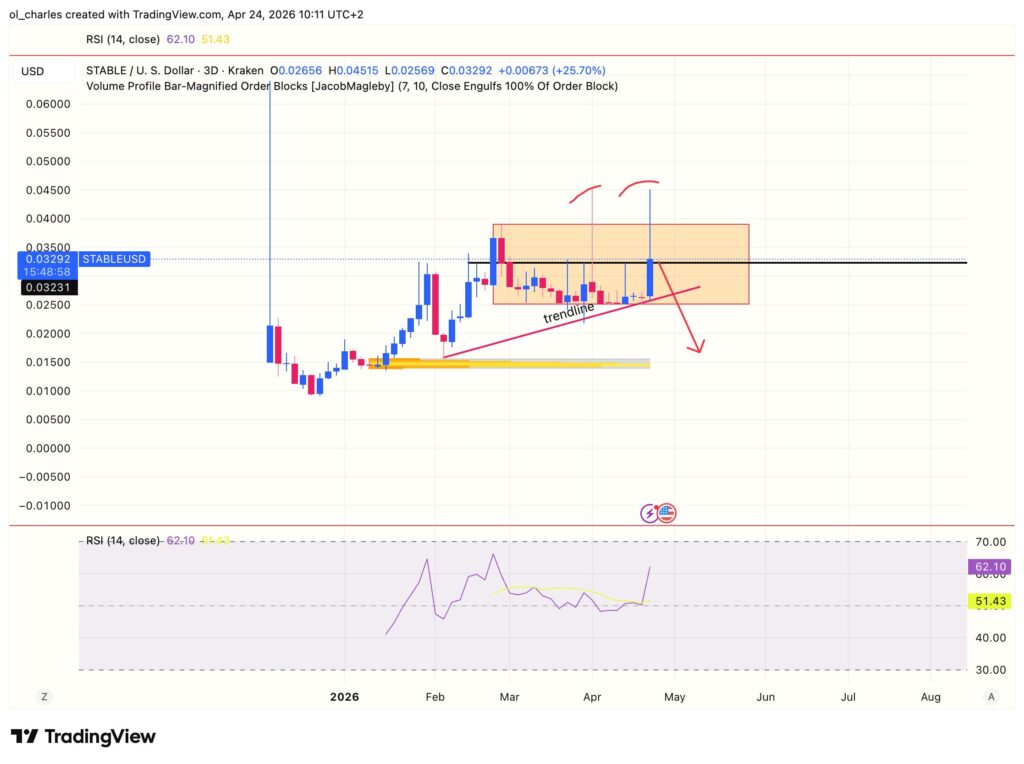
After several weeks of stifling consolidation, STABLE has finally broken its chains to print its highest daily volatility since early February. This impressive 70% single day rally propelled the asset to $0.045, catching many traders positioned short completely off guard.
The spark for this explosion comes from a highly anticipated technical signal: the daily RSI (Relative Strength Index) finally broke a bearish trendline that had been capping the price for nearly three months. This breakout acted as a true catalyst, releasing accumulated buying pressure and confirming a resurgence in momentum.
Trading volumes immediately validated this momentum, posting the largest bullish candle of the past two weeks. This strong return of buyers shows that the market is ready to see STABLE higher. Nevertheless, the reaction was immediate, particularly in terms of profit taking.
Analysis and scenarios: A potential bounce or is it already over?
On the HTF chart, the price structure forms a masterful fake out with a double rejection at the top of its range, a classic reversal pattern that most likely signals a return to the bottom of the range at $0.025.
Related Articles:

