

ADA Price Technical Analysis
CoinMarketCap data reveals that Cardano (ADA) has lost over 24% of its value over the past month. Following this significant drop, the asset has lost its grip on a key support level at $0.64, a level that has historically triggered price reversals and rebounds.
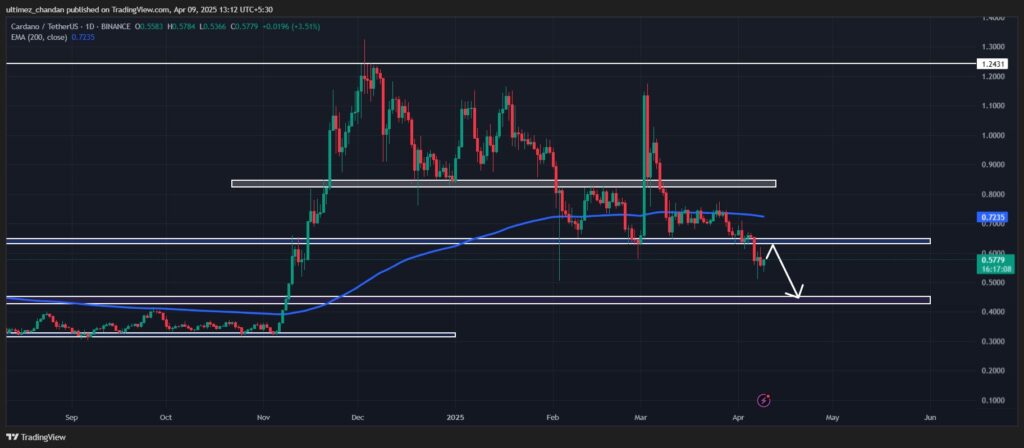
According to Coinpedia’s technical analysis, ADA is poised to continue its bearish momentum, having managed to close a daily candle below the key support level. Additionally, the asset has also retested this breakout level. On a shorter timeframe (4-hour chart), ADA appears to be moving in an upward trend, supported by an ascending trendline.
Cardano Price Predictions
Considering recent price action and historical dynamics, if ADA continues to decline and closes a 4-hour candle below the trendline support, it is highly likely to drop by 20% to reach the $0.43 level in the coming days.
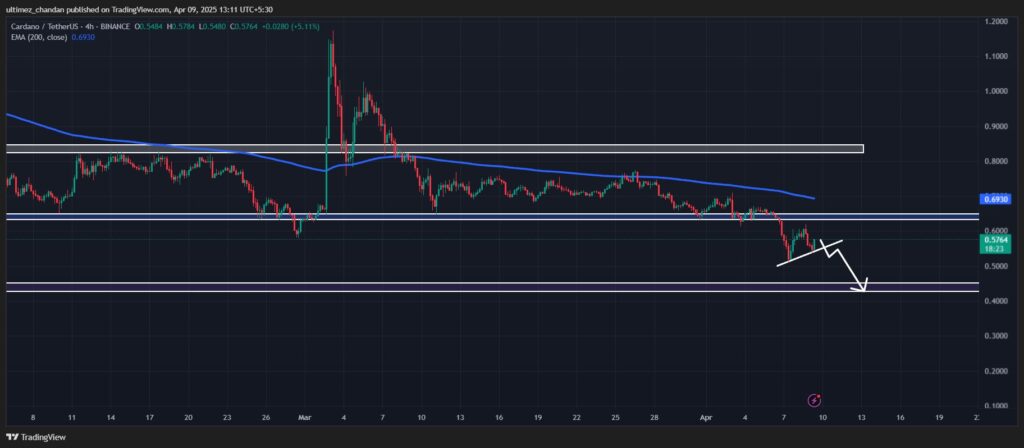
Currently, ADA is trading below the 200-day Exponential Moving Average (EMA) on both the 4-hour and daily charts. This indicates that the asset is in a strong bearish momentum and shows price action weakness. However, in such conditions, investors and traders often look for an upward bounce as a short-selling opportunity.
ADA is currently trading near $0.575 and has recorded a price decrease of over 2% in the last 24 hours. During the same period, its trading volume has dropped by 15%, indicating lower trader and investor participation compared to the previous day.
Furthermore, according to on-chain analysis firm Coinglass, traders appear to be heavily betting on the bearish side, with $16.40 million in short positions. This trader positioning reflects their current view of ADA, which seems bearish. With $16.40 million in short positions, it is highly likely that this will exert downward pressure on ADA in the days ahead.

