

Indicators in Favor of Ethena (ENA)
After a marked period of downward trend since January 2025, the token Ethena (ENA) is showing encouraging signs of recovery this May. The cryptocurrency recently recorded a significant intraday increase of 18% after establishing what seems to be a strong support around the $0.25500 level.
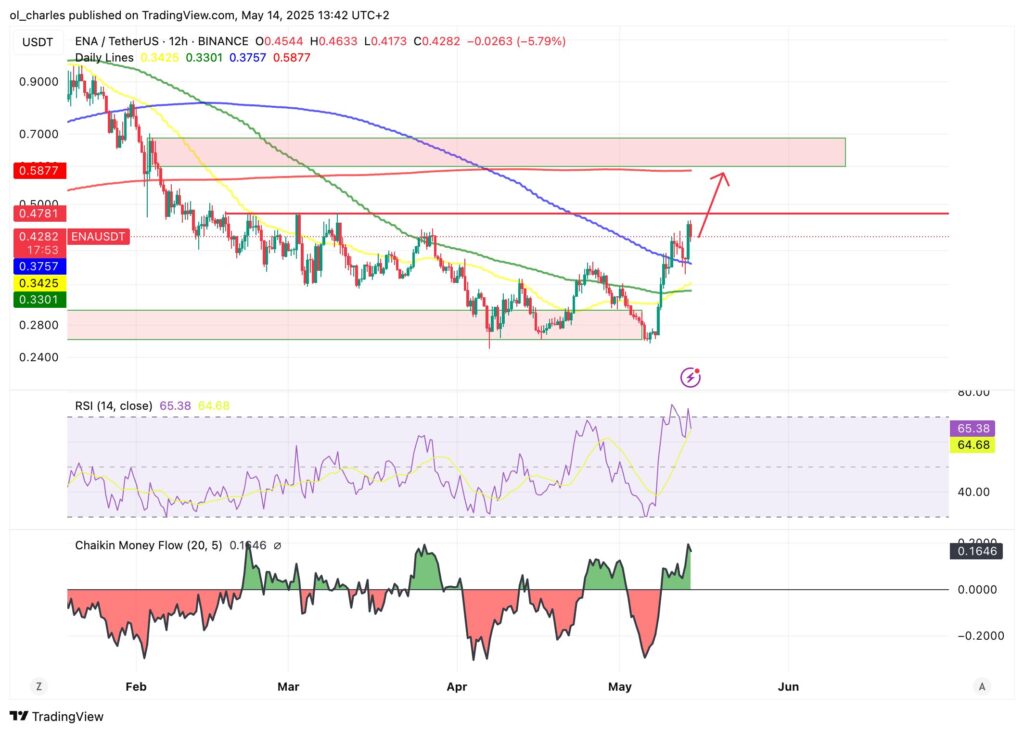
At the time of writing, ENA was trading around $0.4308, with a daily trading volume increasing by 59%, indicating increased buying and selling activity.
Several technical indicators support the thesis of a potential trend reversal for Ethena:
- MACD (Moving Average Convergence Divergence): A bullish crossover was observed, with the MACD line (0.01613) crossing above its signal line (0.00982). The positive and growing histogram reinforces this bullish momentum signal.
- Social Sentiment: The social sentiment indicator shows a strongly positive reading (0.10154), contrasting with the negative sentiment observed in April. Such a change often precedes price recoveries, reflecting increased investor confidence.
- RSI (Relative Strength Index): Currently at 66.61, the RSI shows a clear upward trend since reaching oversold levels in March-April, without yet entering the overbought zone. The upward crossover of its signal line (52.32) confirms this momentum.
- Exponential Moving Averages (EMA): ENA’s price is poised to test its 200-day moving average (currently at $0.58850), a critical resistance level. ENA has been trading below this indicator since late January, and a breakthrough would signal a major bullish move. In the short term, the 100-day moving average ($0.37374) has already been surpassed, which is generally considered a positive sign.
Key Support and Resistance Levels to Watch
For traders and investors following ENA, several key levels are worth monitoring:
- Support: The $0.25500 level has been tested several times since March and appears to be a strong base.
- Immediate Resistances: The 100-day EMA at $0.37 and the 20 and 50 EMAs at $0.32.
- Next Resistances (if broken): The $0.60 – $0.70 range could be the next target.
The technical analysis of Ethena (ENA) suggests a potential trend reversal may be underway, with several indicators pointing towards a resumption of bullish momentum.
ENA seems poised to test its 200-day moving average and enter the $0.60 range. Cryptobull even points towards $0.80 in the coming days. However, this could be an ideal zone for traders to take their profits.
Therefore, confirmation of the continuation and holding above this moving average should be awaited before entering. For short-term entry, it is important to use a stop loss or wait for a retracement towards the 100-day moving average at $0.377.

